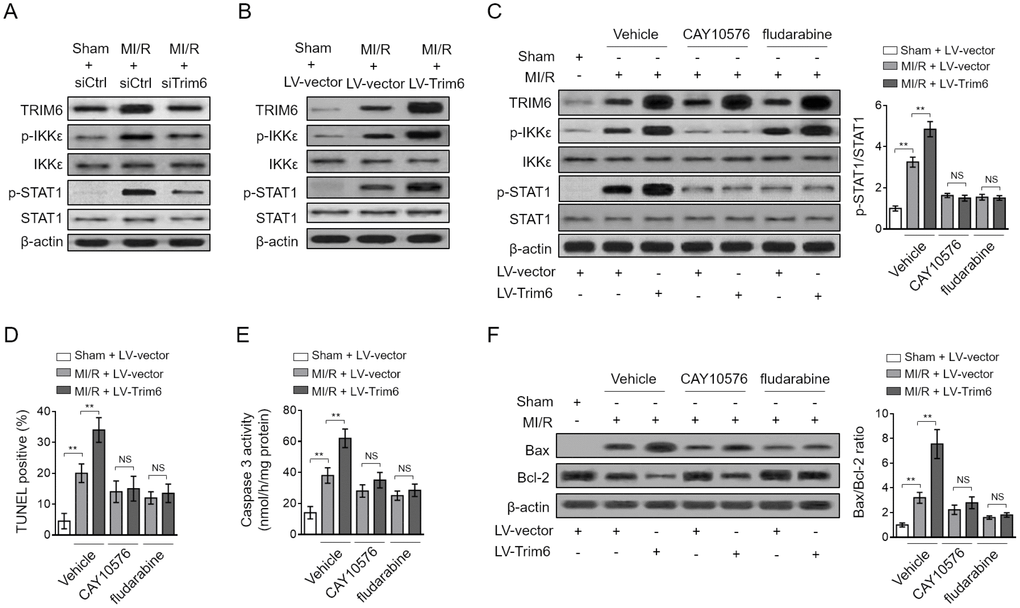
Figure 4.TRIM6 promotes myocardial apoptosis through inducing IKKε-mediated STAT-1 activation after MI/R injury. (A) The mouse heart was pre-transfected in vivo with control siRNA (siCtrl) or siRNA targeting Trim6 (siTrim6) 48 hrs before surgery. Mice were then subjected to sham surgery or experimental MI/R. Each group contained 7 mice. At 24 hrs after reperfusion, the hearts were harvested for analyses. The protein expression of TRIM6, p-IKKε, IKKε, p-STAT1 and STAT1 in the heart was determined by Western blotting analysis. β-Actin was used a loading control. (B) The mouse heart was pre-infected in vivo with lentivirus expressing vector control (LV-vector) or Trim6 (LV-Trim6) 48 hrs before surgery. Mice were then subjected to sham surgery or experimental MI/R. Each group contained 7 mice. At 24 hrs after reperfusion, the hearts were harvested for analyses. The protein expression of TRIM6, p-IKKε, IKKε, p-STAT1 and STAT1 in the heart was determined by Western blotting analysis. β-Actin was used a loading control. (C–F) The mouse heart was pre-infected in vivo with lentivirus expressing vector control (LV-vector) or Trim6 (LV-Trim6) in the presence or absence of CAY10576 or fludarabine 48 hrs before surgery. Mice were then subjected to sham surgery or experimental MI/R. Each group contained 7 mice. At 24 hrs after reperfusion, the hearts were harvested for analyses. (C) The protein expression of TRIM6, p-IKKε, IKKε, p-STAT1 and STAT1 in the heart was determined by Western blotting analysis. β-Actin was used a loading control. Shown here are representative images (left) and the p-STAT1/STAT1 ratio relative to sham (right). (D) The myocardial apoptosis in the heart sections was identified by TUNEL staining. The quantitative analysis of TUNEL-positive cardiomyocytes is shown (%). (E) The caspase-3 activity of the heart was measured and expressed as nmol per hr per mg protein. (F) The protein expression of Bax and Bcl-2 was determined by Western blotting analysis. β-Actin was used a loading control. The representative images (left) and the Bax/Bcl-2 ratio relative to sham (right) are shown. All data are expressed as mean ± SD (n = 7). **, P < 0.01; NS, not significant.