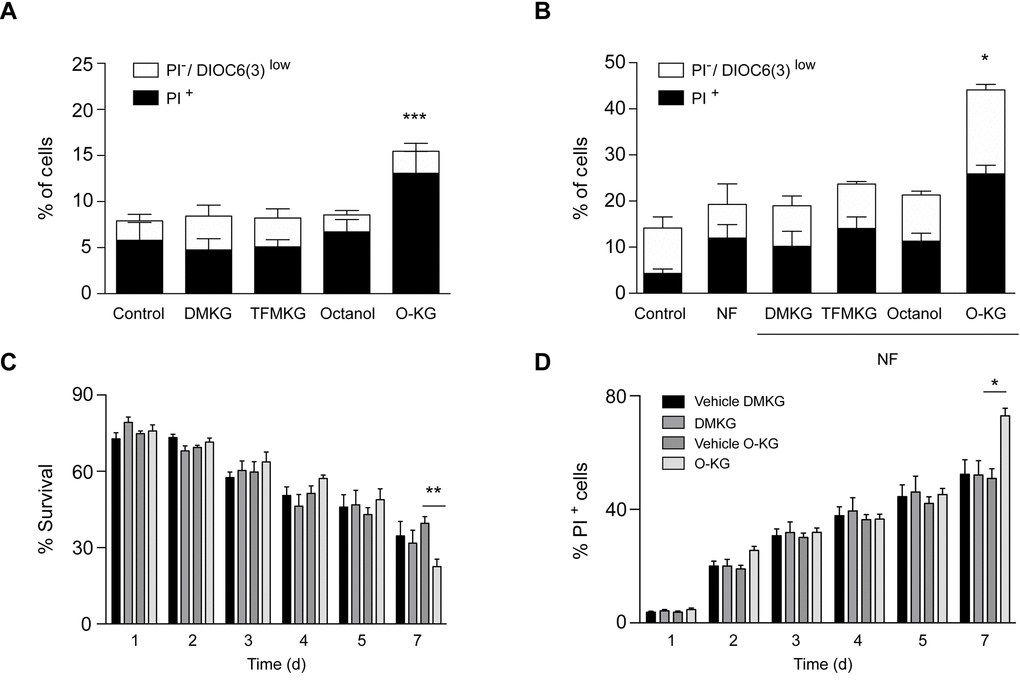
Figure 4.Impact of α-ketoglutarate precursors on cell viability. (A-B) Cytofluorimetric assessment of cell death elicited upon administration of distinct α-ketoglutarate precursors to U2OS cells in complete (A) or nutrient free medium (NF) (B) for 4 h. PI+ = dead cells; PI-/DiOC6(3) low cells = dying cells. Data (depicted as percentage of cells) represent mean ± S.D. (one representative experiment, n=3). *** p < 0.001 (compared to Control); * p < 0.05 (compared to NF) (unpaired t test). (C). Survival rates of treated (200 µM) and control cells were analyzed at indicated timepoints via clonogenicity assay. (D) Plasma membrane integrity via PI staining of treated (200 µM) versus control yeast cells was monitored at indicated timepoints during chronological aging. Data represent mean ± S.E.M of at least 3 independent experiments. ** p < 0.01; * π < 0.05 (Compared to O-KG vehicle); (two-way Anova).