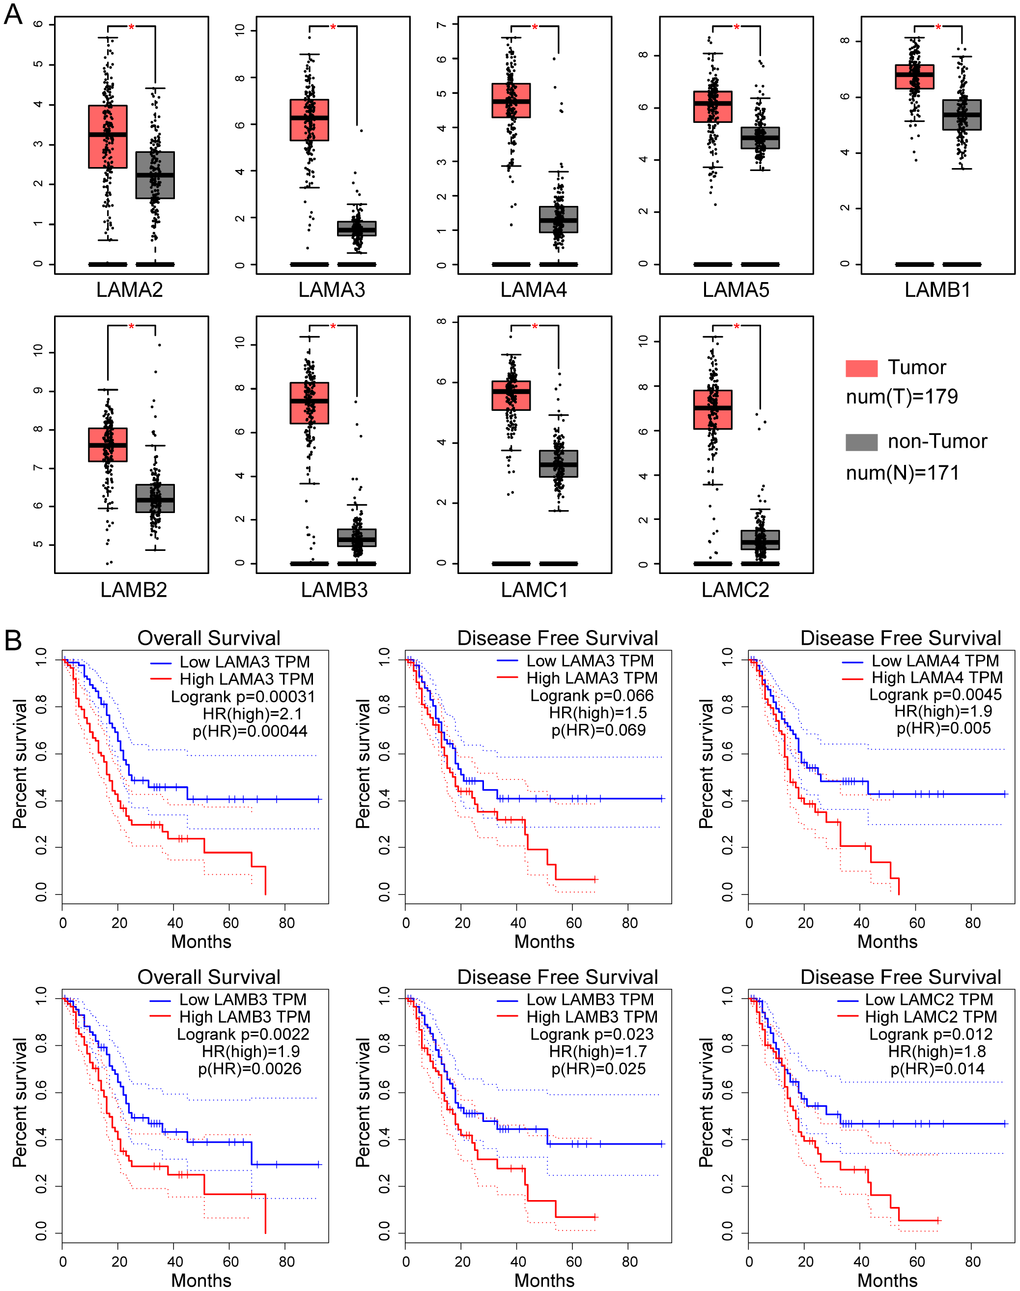
Figure 1.Expression and survival analysis of the laminin gene family in TCGA PAAD cohort. (A) Differential expression of genes of the laminin family in pancreatic cancer and non-tumor tissues. The red asterisk indicates that the difference is statistically significant (p<0.05). (B) Kaplan–Meier survival curves of the OS and DFS for high and low laminin gene expression groups, depicted using GEPIA. The cutoff value was set at median expression. The dotted line indicates a 95% confidence interval.