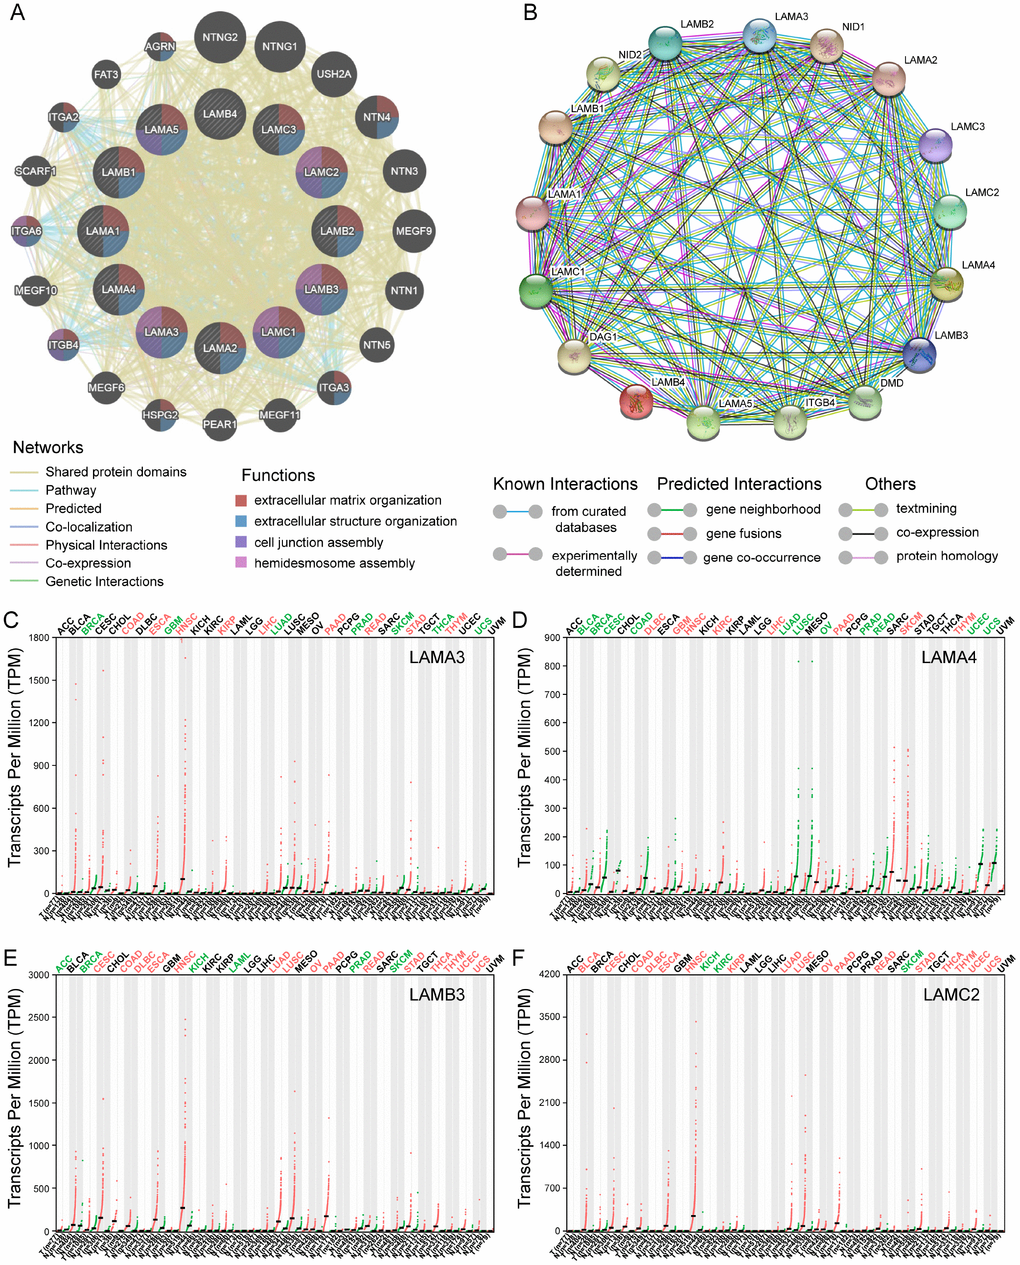
Figure 2.Gene-gene interaction and protein-protein interaction network of genes of the laminin family, and differential expression of laminin genes in various tumor and non-tumor tissues. (A) The gene network associated with the laminin gene family, drawn using GeneMANIA. The colored patches on the circle indicate the function of the gene. (B) A network diagram of interactions between proteins encoded by genes of the laminin family, drawn using STRING. (C–F) The difference in expression of LAMA3, LAMA4, LAMB3 and LAMC2 in various tissues in TCGA, drawn using GEPIA. Green color indicates that the gene is downregulated, whereas red color indicates upregulation of the gene.