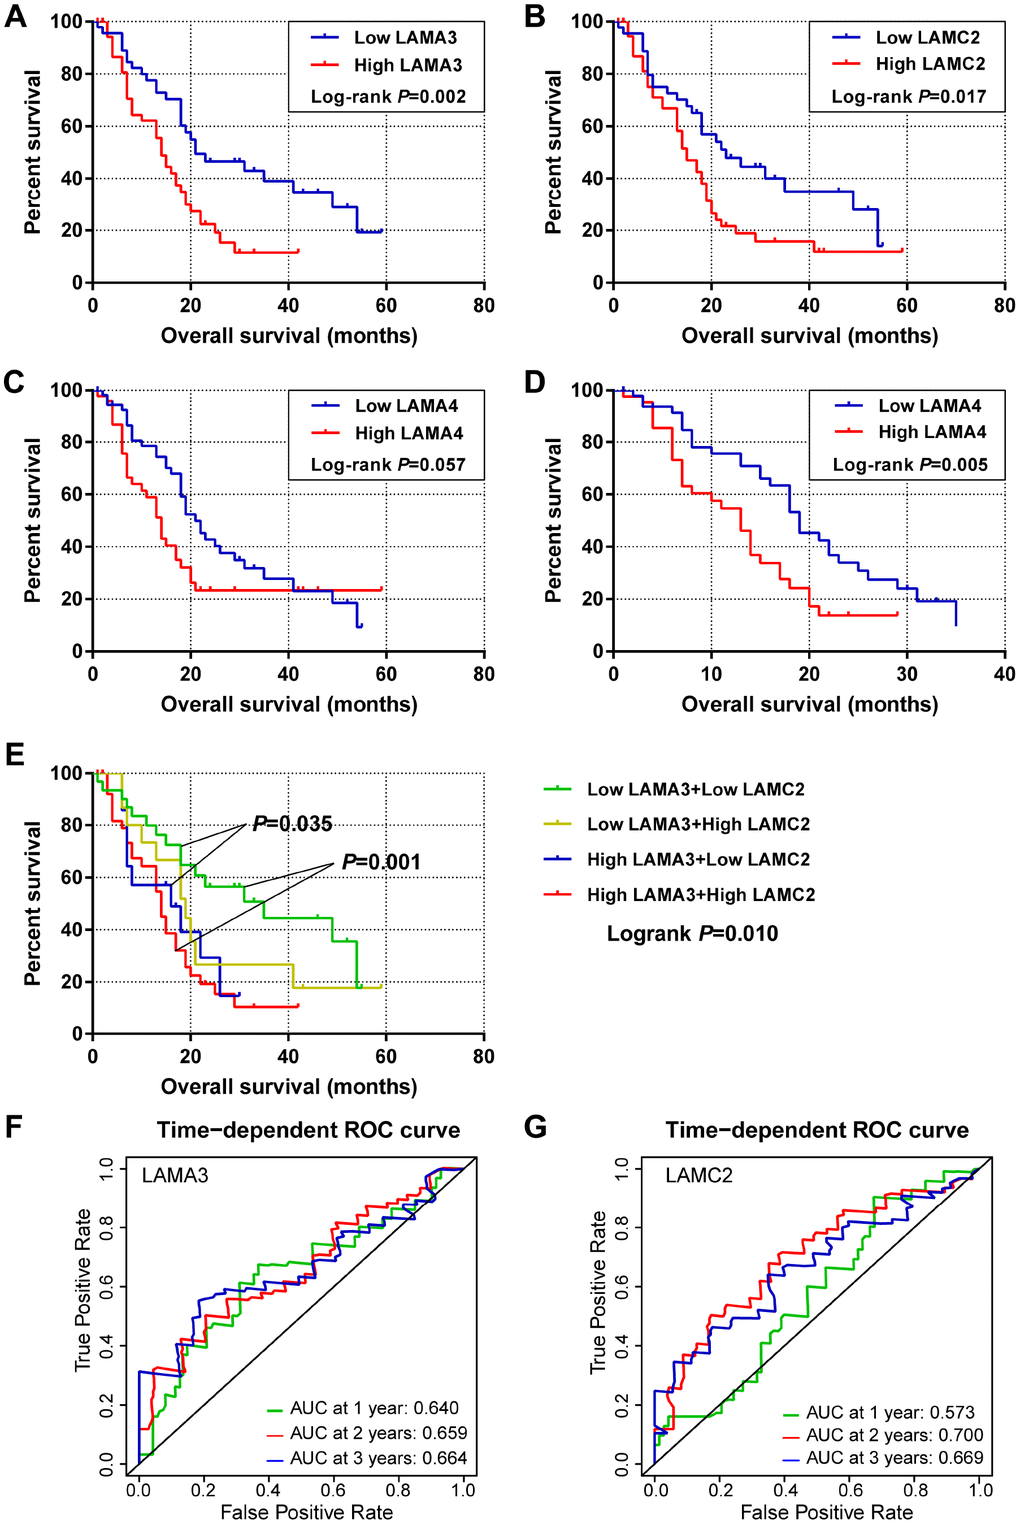
Figure 3.Survival and survivalROC analysis of LAMA3 and LAMC2 expression in the GSE21501 PDAC cohort. (A–C) Kaplan–Meier survival curves for OS of the LAMA3, LAMC2 and LAMA4 gene expression groups. (D) Kaplan–Meier survival curves for 3-year OS for LAMA4 expression groups. (E) Kaplan–Meier survival curves for OS of the combined LAMA3 and LAMC2 gene expression groups. (F–G) Time-dependent ROC curve for LAMA3 and LAMC2 expression in PDAC patients.