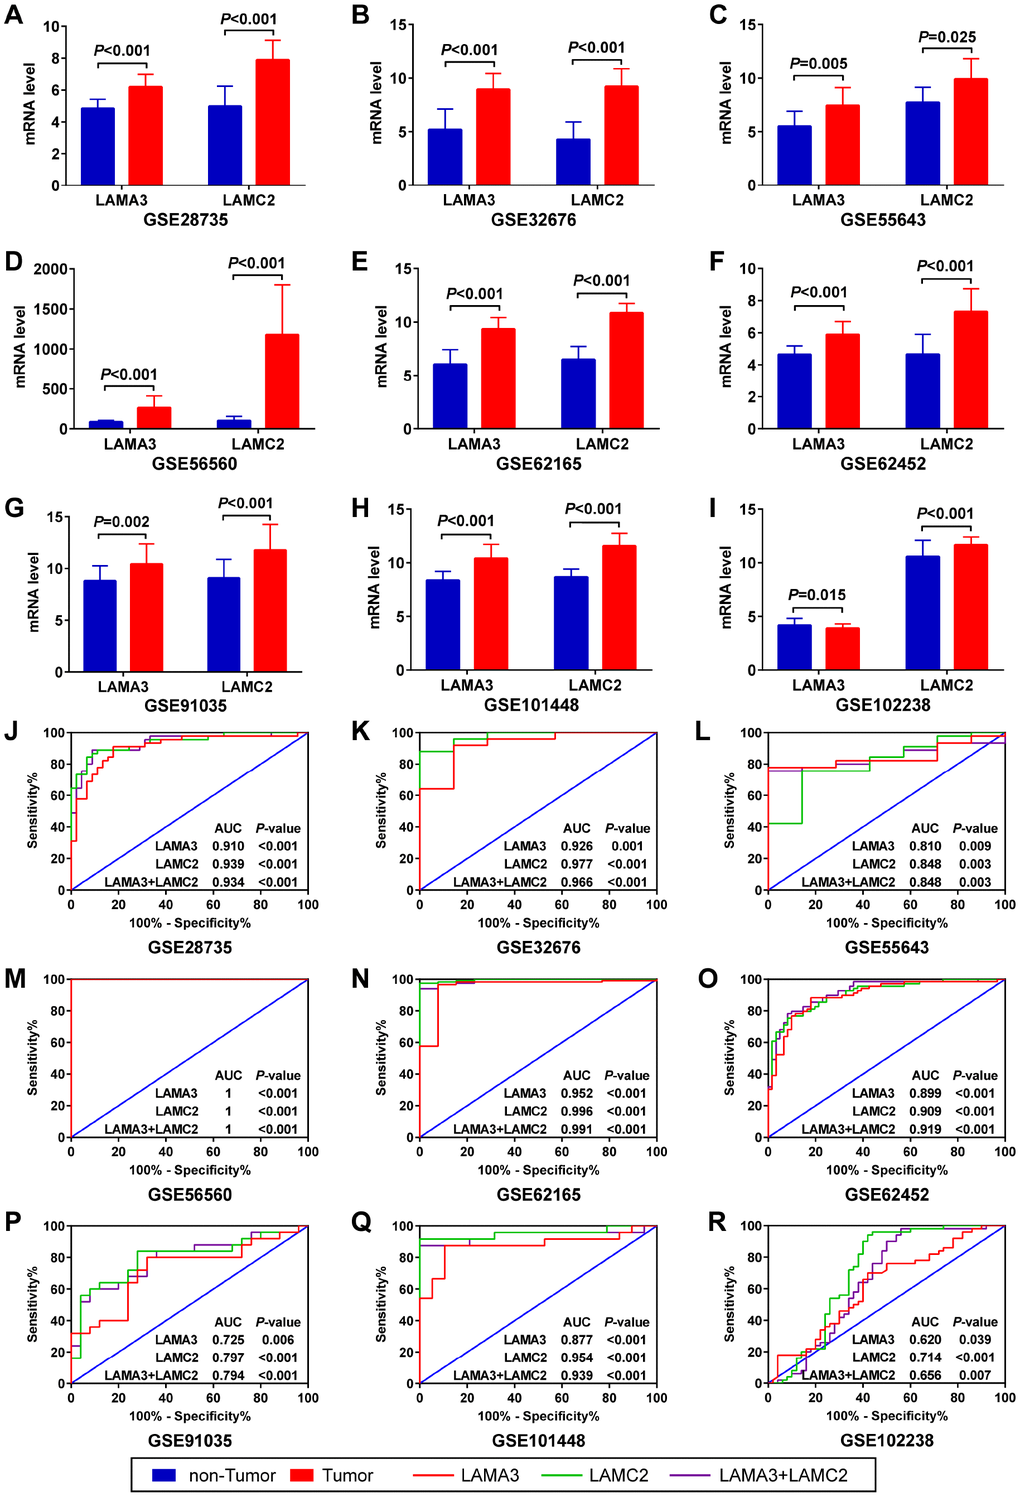
Figure 4.Expression and ROC analysis of LAMA3 and LAMC2 in GEO PDAC and non-tumor tissues. (A–I) Comparison of LAMA3 and LAMC2 gene expression in tumor and non-tumor tissues. (J–R) ROC curve of LAMA3, LAMC2 and combined expression for distinguishing between PDAC and non-tumor tissues.