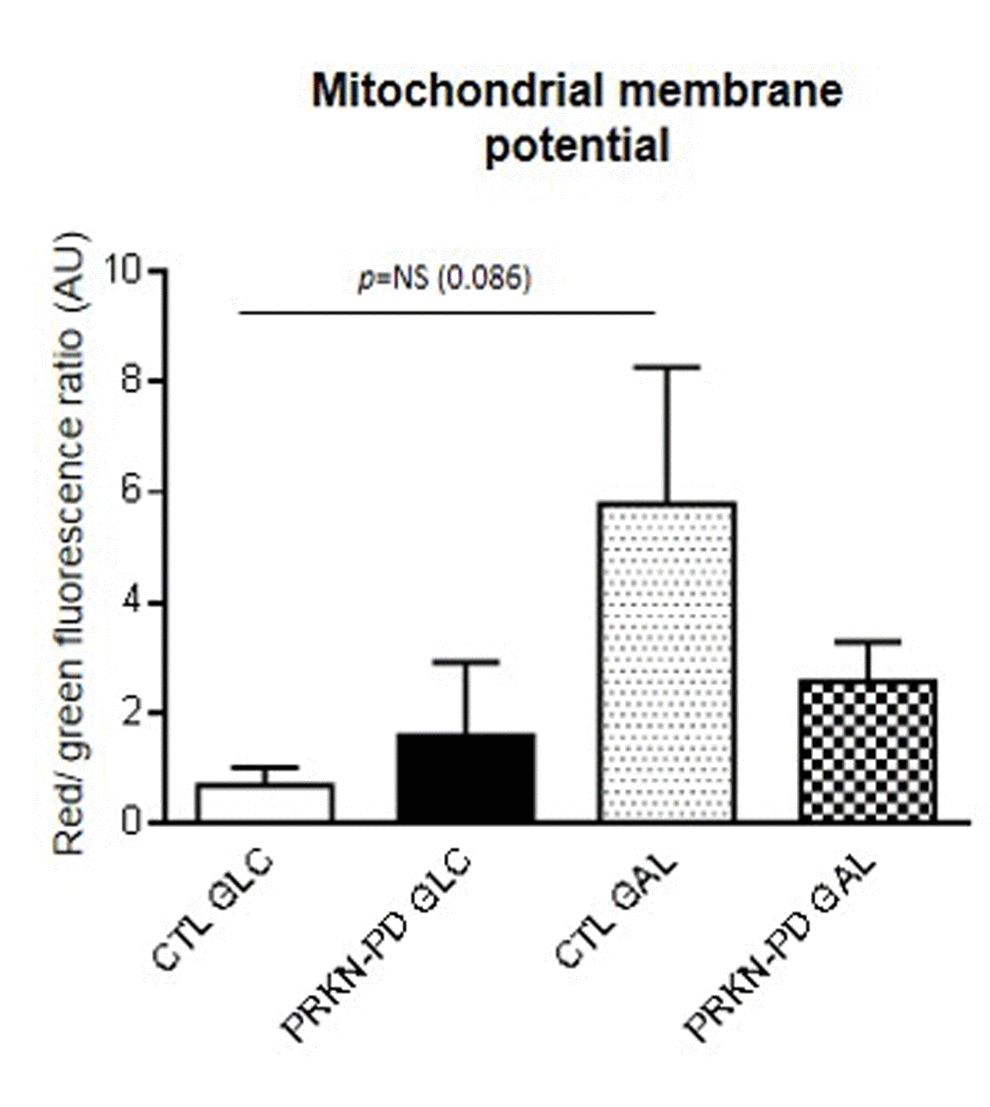
Figure 5.Mitochondrial membrane potential in control and PRKN-PD fibroblasts. Mitochondrial membrane potential is represented as the ratio of red vs. green fluorescence signals of JC-1 representing the cells with correctly polarized vs the cells with depolarized mitochondria. No significant differences in mitochondrial membrane potential were obtained between groups. Upon galactose exposure, control fibroblasts trended to enhance mitochondrial membrane potential as compared to glucose, while PRKN-PD fibroblasts remained unchanged. The results are expressed as means and standard error of the mean (SEM). AU= Arbitrary units. CTL= Control fibroblasts. GAL= 10 mM galactose medium. GLC= 25 mM glucose medium. JC-1: 5,5’,6,6’-tetrachloro-1,1’,3,3’-tetraethylbenzimidazol-carbocyanine iodide. NS= not significant. PRKN-PD= Parkin-associated PD fibroblasts.