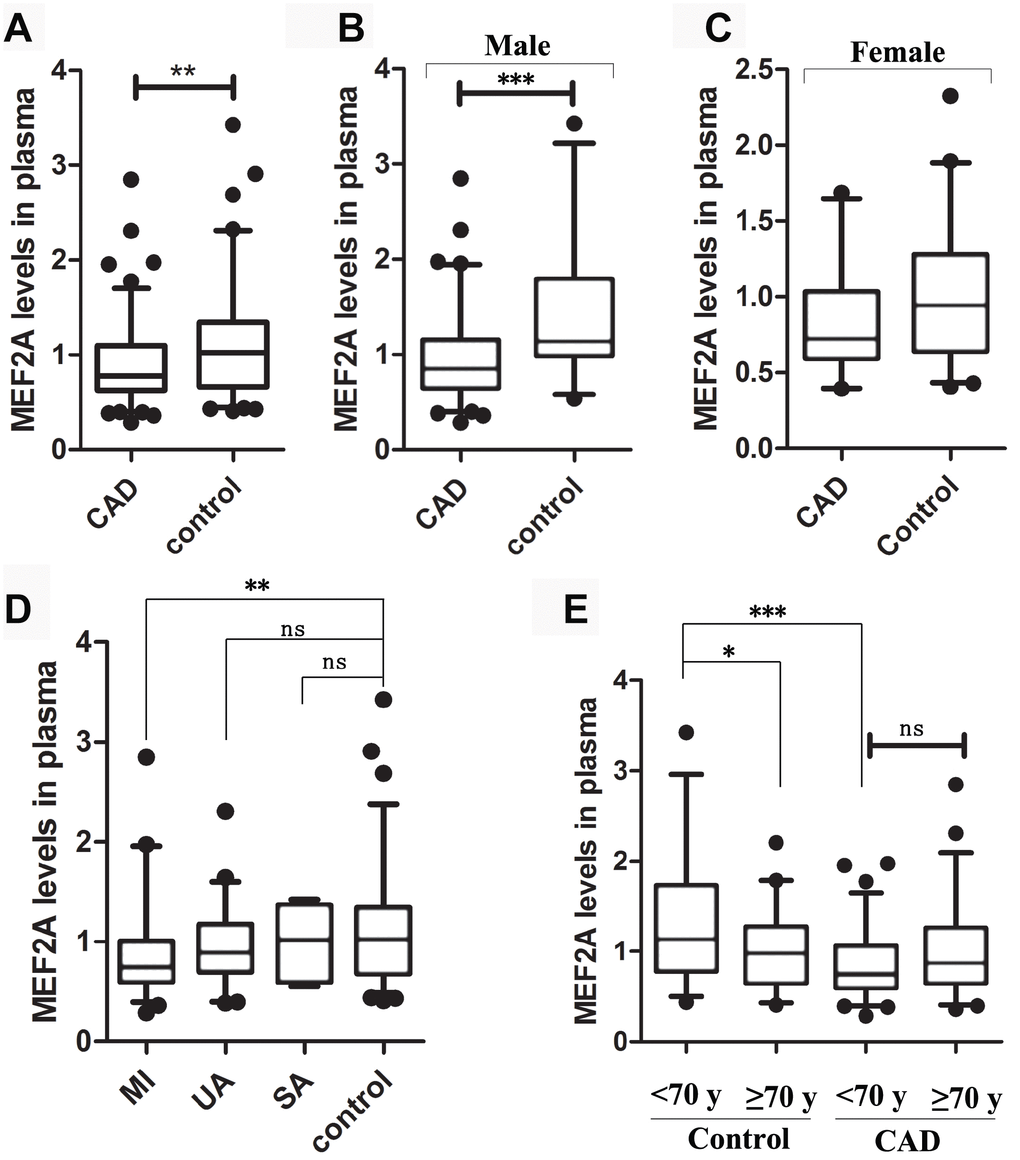
Figure 6.The statistical distribution of the plasma level of MEF2A in different groups or sub-groups. (A) Plasma MEF2A levels in CAD group and normal control group. (B) Plasma MEF2A levels in male CAD subgroup and male control subgroup. (C) Plasma MEF2A levels in female CAD subgroup and female control subgroup. (D) Plasma levels of MEF2A in the subgroups: myocardial infarction subgroup (MI), unstable angina pectoris subgroup (UA), stable angina pectoris subgroup (SA), and in the controls. (E) Plasma levels of MEF2A in the subgroups categorized by age. The statistical distribution was presented with Box and whisker plot. The horizontal lines within the boxes represent the median value and the vertical lines extending below and above the boxes indicate 5-95% percentile values, respectively. The significant difference between any two groups or subgroups was tested by using Wilcoxon rank sum test. *, P < 0.05; **, P < 0.01; ***, P < 0.001.