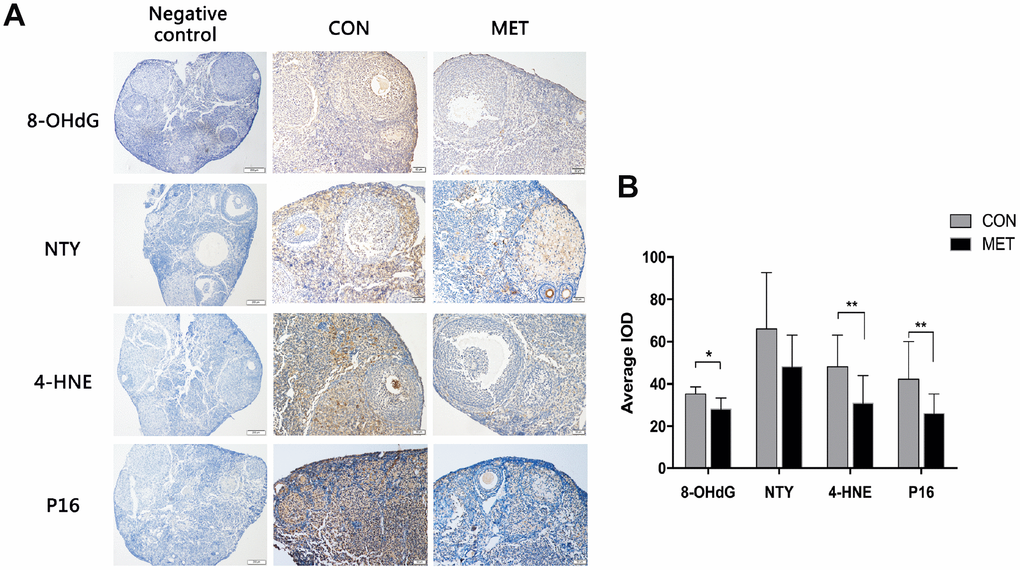
Figure 4.Effects of MET on oxidative damage markers and the p16 level in both groups. (A). The representative IHC images of p16 protein in the CON and MET mouse ovaries. (B). Average IOD of the markers in the two groups. Values are expressed as mean± S.E.M. *indicates a significant difference between the two group. *P<0.05, **P < 0.01.