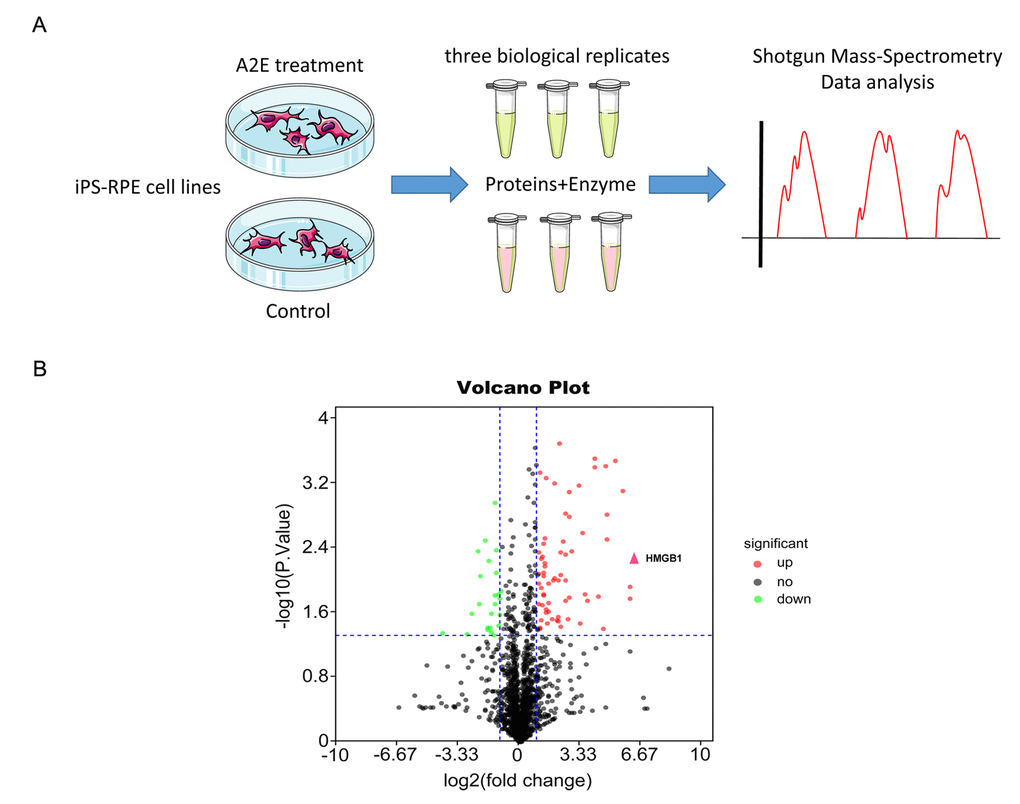
Figure 1.Proteomic mass spectrometry-based measurement of differential expression of HMGB1. (A) The flow chart of shotgun mass spectrometry. (B) Volcano plot illustrating significant differential abundant proteins based on quantitative analysis. The -log10 (P value) was plotted against log2(fold change A2E treatment/Control). Proteins were significantly upregulated (red dots) or downregulated (green dots) between the A2E treatment and control. The red arrowhead indicates HMGB1.