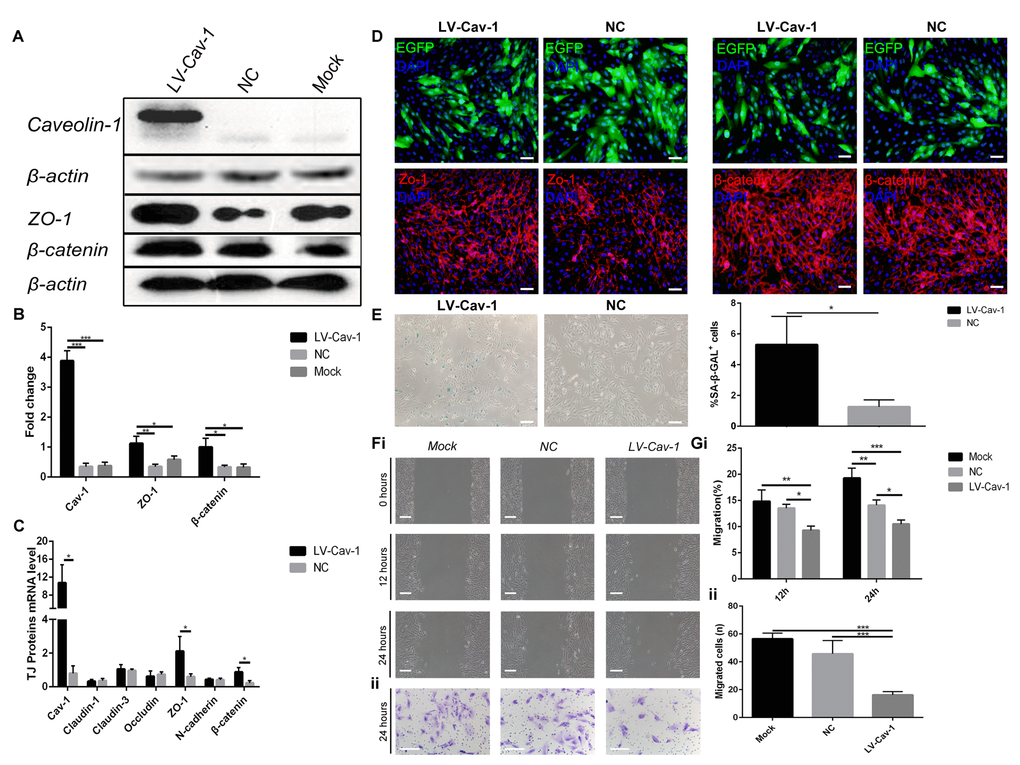
Figure 4.Overexpression of Caveolin-1 induced ARPE-19 cell senescence and inhibited migration and invasion. (A) Western blot analyses showed that overexpression of Caveolin-1 upregulated Zo-1 and β-catenin; β-actin was used as the loading control. (B) Western blot results were quantified by densitometry, and the results are expressed as a ratio with β-actin. Data are presented as means ± SD; * indicates a p value < 0.05, ** indicates a p value < 0.01, *** indicates a p value < 0.001, n=3. (C) qPCR analyses showed that overexpression of Caveolin-1 upregulated Zo-1 and β-catenin. Data are presented as means ± SD; * indicates a p value < 0.05, n=3. (D) Expression of EGFP, Zo-1 and β-catenin was assessed by immunofluorescence in Caveolin-1-overexpressing RPE cells and negative-control RPE cells. (E) Representative microscopic images of β-galactosidase staining in RPE cells showed overexpression of Caveolin-1 in RPE cells compared with that in negative-control RPE cells. Quantification of percentage of cells with positive SA-β-gal staining.Data are presented as means ± SD; * indicates a p value < 0.05, ** indicates a p value < 0.01, n=3. (F) (i) Wound-healing assays in Caveolin-1-overexpressing RPE cells. (ii). Transwell invasion assays in Caveolin-1-overexpressing RPE cells. (G) (i) The rate of cell migration in different groups was measured at different time points. Note that cell migration was decreased in Caveolin-1-overexpressing RPE cells. (ii) The mean number of invaded cells was assessed in 5 fields. Note that cell invasion was decreased in Caveolin-1-overexpressing RPE cells. Data are presented as means ± SD; * indicates a p value < 0.05, ** indicates a p value < 0.01, *** indicates a p value < 0.001, n=3.