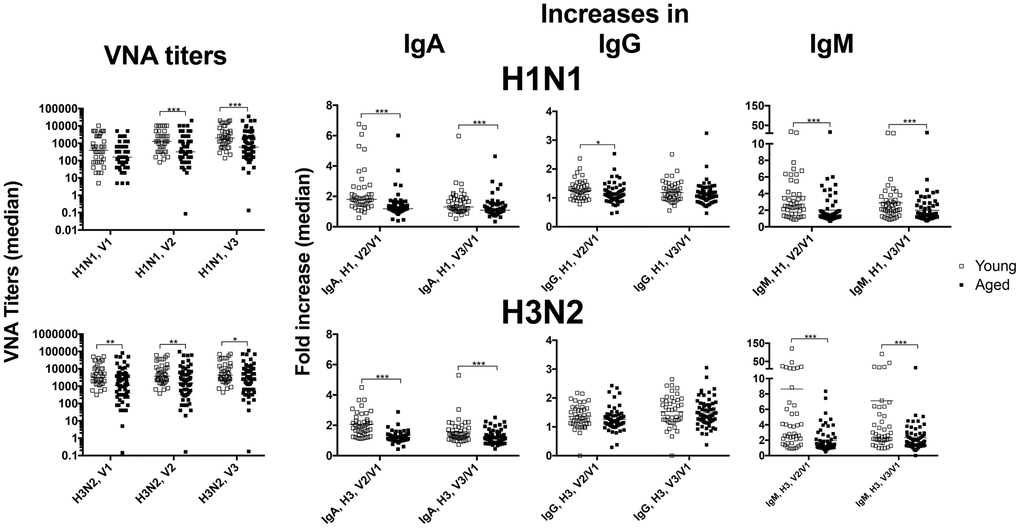
Figure 1.Antibody responses. Sera from younger (open squares) and older (closed squares) individuals were tested for VNAs and antibodies of different serotypes specific for H1N1 (upper graphs) or H3N2 viruses (lower graphs). The graphs show absolute values for VNA titers and fold increase over baseline (visit 1 [V1]) for IgA, IgG and IgM by dividing amounts of antibody in μg/ml (extrapolated from using standards for each isotype) after vaccination by those obtained at baseline. Graphs show data for individual samples with medians. Lines with star above indicate significant differences by Mann-Whitney. * p-value between <0.05-0.01, ** p-value between <0.01 and 0.001, *** p-value between <0.001 and 0.0001, **** p-value <0.0001.