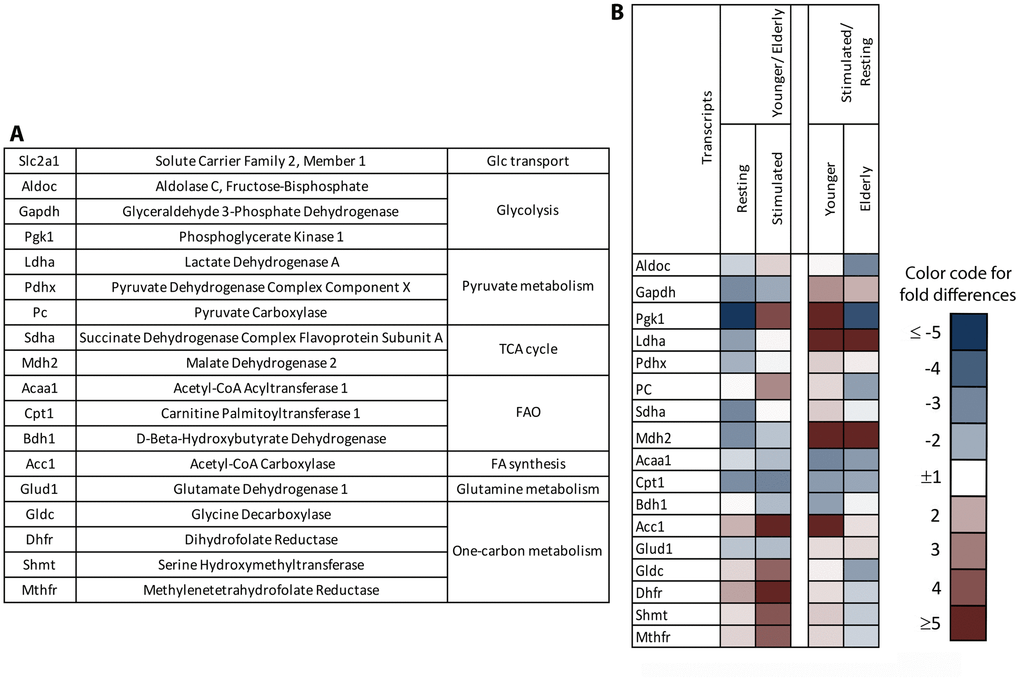
Figure 4.Gene expression profiles of naïve B cells undergoing stimulation. Naïve B cells isolated from PBMCs of younger or aged individuals were cultured for 24 hours with (stimulated) or without (resting) polyclonal activators. cDNA was generated and probed with primers to the indicated factors (A) by comparative (c)PCR. (B) The heatmap to the left shows age-related differences in levels of transcripts between resting or stimulated B cells comparing younger to elderly individuals. The heatmap to the right shows activation induced changes in younger and aged B cells. Blue shows reduced levels and red shows enhanced levels of transcripts in the younger compared to aged B cells (left) or in stimulated compared to resting B cells (right). Color intensities indicate magnitude of differences as shown in the legend.