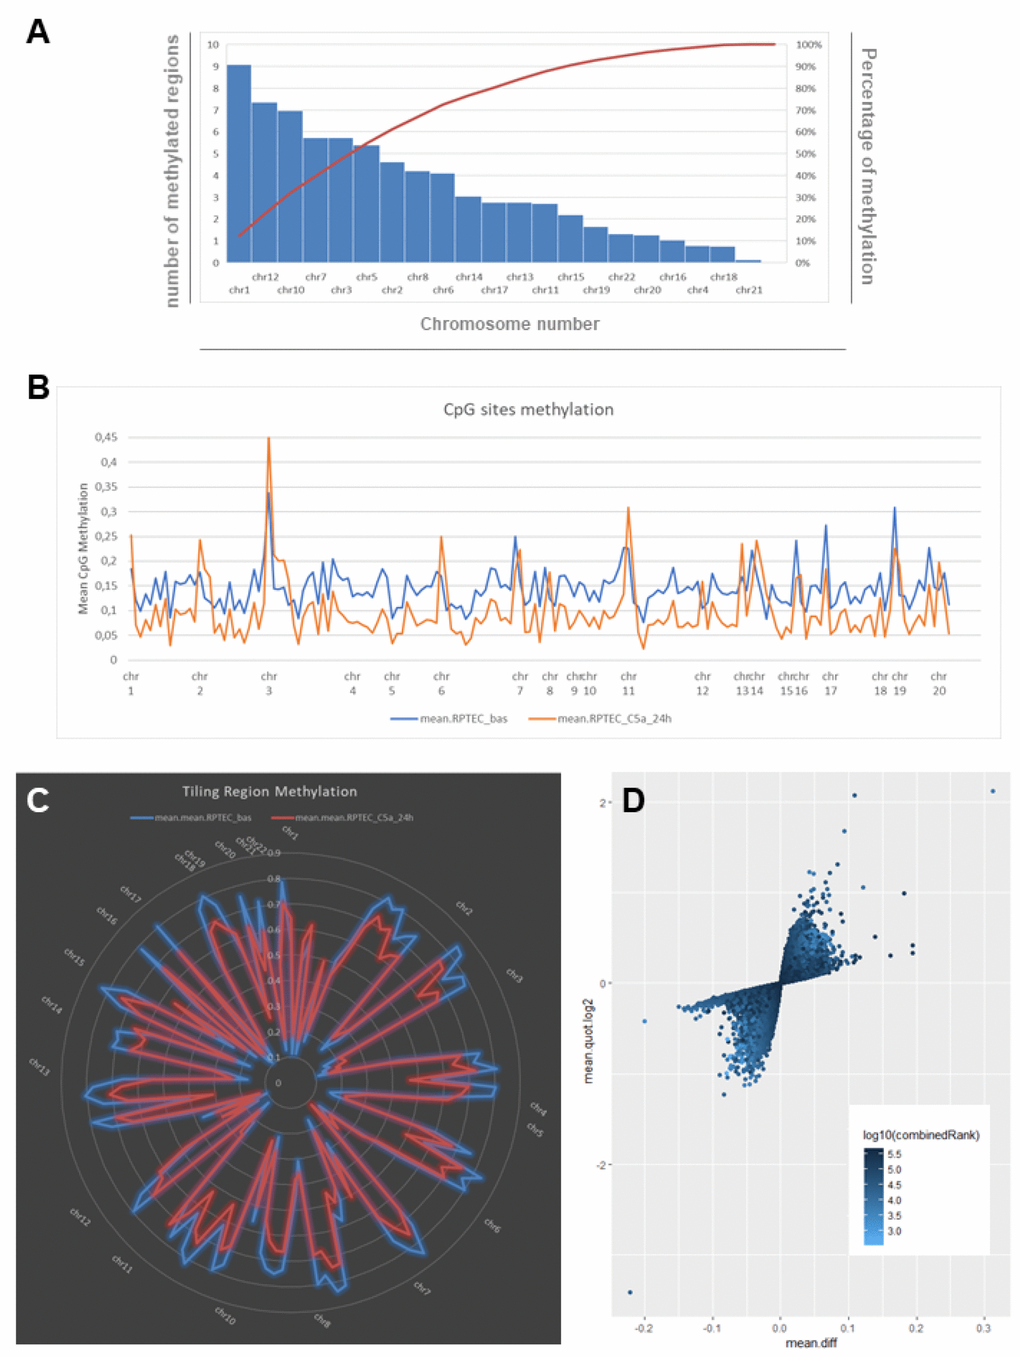
Figure 1.C5a-associated changes in DNA methylation as indicated by whole-genome bisulfite assay in RTEC. (A) Chart showing the number and the frequency of methylated regions (tiling regions) identified in RTEC at basal level. The left vertical axis represents the number of methylated regions per each chromosome. The right vertical axis indicates the cumulative percentage of the total number of occurrences. The red concave curve is the cumulative function indicating that the 50% of the total methylated regions in RTEC are covered by chromosomes 1, 12, 10, 7 and 3. (B) DNA methylation levels at the single CpG sites for RTEC at basal level (blue line) and for RTEC stimulated by C5a (orange line). C5a decreased the DNA methylation in the overall genome. (C) Graph showing the mean DNA methylation levels of tiling regions, shared for chromosomes, in RTEC (blue line) and in C5a-stimulated RTEC (red line). The central axis shows the mean β methylation value. (D) Scatterplot of the CpG site methylation comparison, colored according to the combined ranks of a given site. Values are represented as mean differences (mean.diff) between stimulated and unstimulated RTEC for each CpG site. (Combined rank: difference in mean methylation levels of stimulated and non-stimulated RTEC, the quotient in mean methylation and the t test are ranked for all regions. This value aggregates them using the maximum, i.e. worst rank of a site among the three measures.)