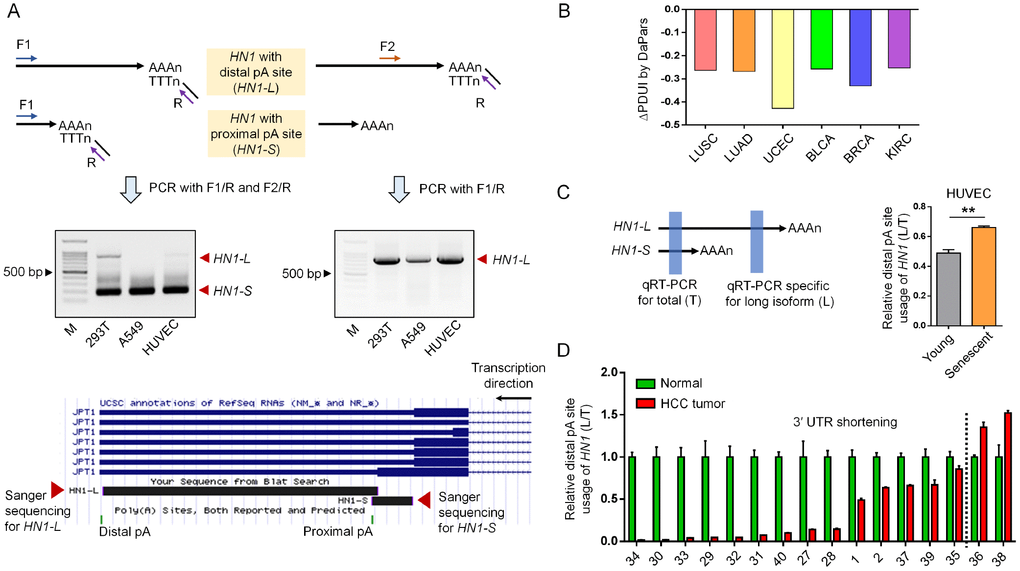
Figure 1.APA-mediated 3′ UTR length changes of HN1 in cancer and senescent cells. (A) 3′ RACE assay to validate HN1 (also known as JPT1) isoforms with different 3′ UTR length in HEK293T, A549, and HUVEC cells. Forward (F) and Reverse (R) primer pairs used in the 3′ RACE were illustrated (top panel), followed by the gel image showing the PCR fragments representing two isoforms with different 3′ UTR length (middle panel). 3′ RACE amplicon corresponding to either distal or proximal pA site was Sanger sequenced and mapped to human genome (hg38), as was illustrated by UCSC Genome Browser (bottom panel). (B) APA-mediated 3′ UTR shortening of HN1 in six cancer types comparing to matched normal tissues based on public data [17]. Y axis stands for the ΔPDUI value (change in Percentage of Distal polyA site Usage Index) quantified by DaPars method. A minus ΔPDUI value represents 3′ UTR shortening. (C) qRT-PCR assay to evaluate the usage of distal pA site (L) compared to the total isoform expression (T) of HN1 among young (passage 6) and senescent (passage 15) HUVECs (**, t-test, p < 0.01). Left panel showed diagram of the primer pair design, as highlighted in blue rectangle. Right panel showed qRT-PCR result. (D) The relative expression of long isoform normalized to total HN1 expression (L/T) was measured by qRT-PCR assay among 16 paired samples of hepatocellular carcinoma (HCC). The numbers in the X axis represent the labeling ID of given patients. Left part to the dashed black line represented patients with 3′ UTR shortening of HN1.
Figure 1 — HNRNPA1-mediated 3′ UTR length changes of HN1 contributes to cancer- and senescence-associated phenotypes | Aging