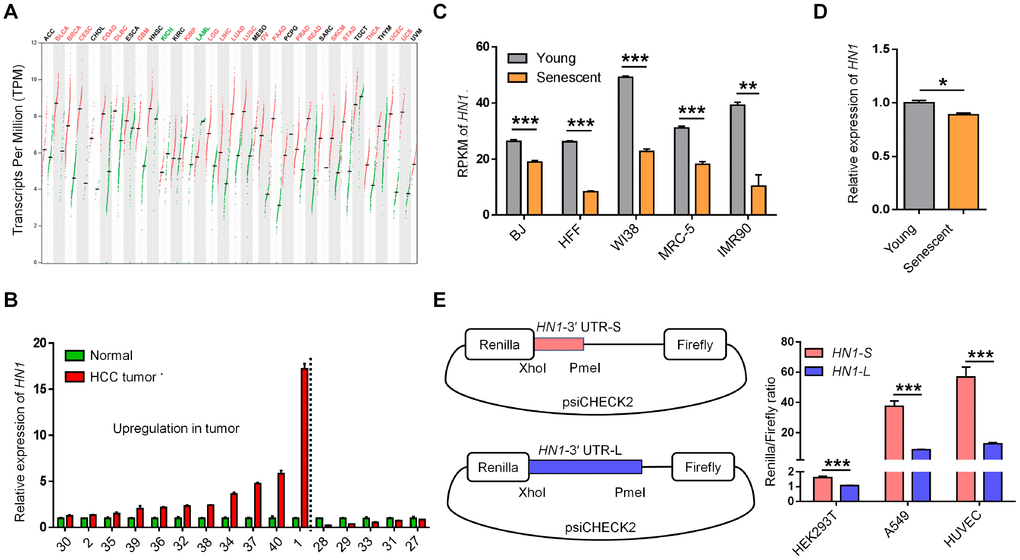
Figure 2.The opposite expression pattern of HN1 between cancer and senescence. (A) HN1 mRNA expression in various cancer types based on GEPIA [23]. The red line and green line within a rectangle represent tumor tissues and normal tissues, respectively. Median expression values were denoted with the crossed black short line. Significantly increased and decreased expressions in tumor comparing to matched normal tissue indicated as red and green fonts at the top, respectively. (B) qRT-PCR measured HN1 expression levels in paired normal and tumor tissues of 16 HCC patients. The numbers on X axis represents the same labeling ID of a patient as described in Figure 1D. Left part to dashed line represented patients with upregulation of HN1. (C) HN1 expression in various senescent cells based on public RNA-seq datasets [24], indicated by RPKM (reads per kilobase per million reads). Lower HN1 expression was observed in five human senescent models (error bars and t-test were based on three biological replicates. **, p < 0.01; ***, p < 0.001). (D) HN1 expression changes between young (passage 6) and senescent (passage 15) HUVECs evaluated by qRT-PCR. * stands for p < 0.05 (t-test with three PCR replicates). (E) Dual-luciferase reporter assay to test the influence of 3′ UTRs (HN1-S and HN1-L) on protein production in HEK293T, A549, and HUVEC cells. Relative luminescence of Renilla luciferase was normalized using the reference Firefly luciferase activity, as shown in the left panel. *** represents a p value less than 0.001 in t-test with four biological replicates.