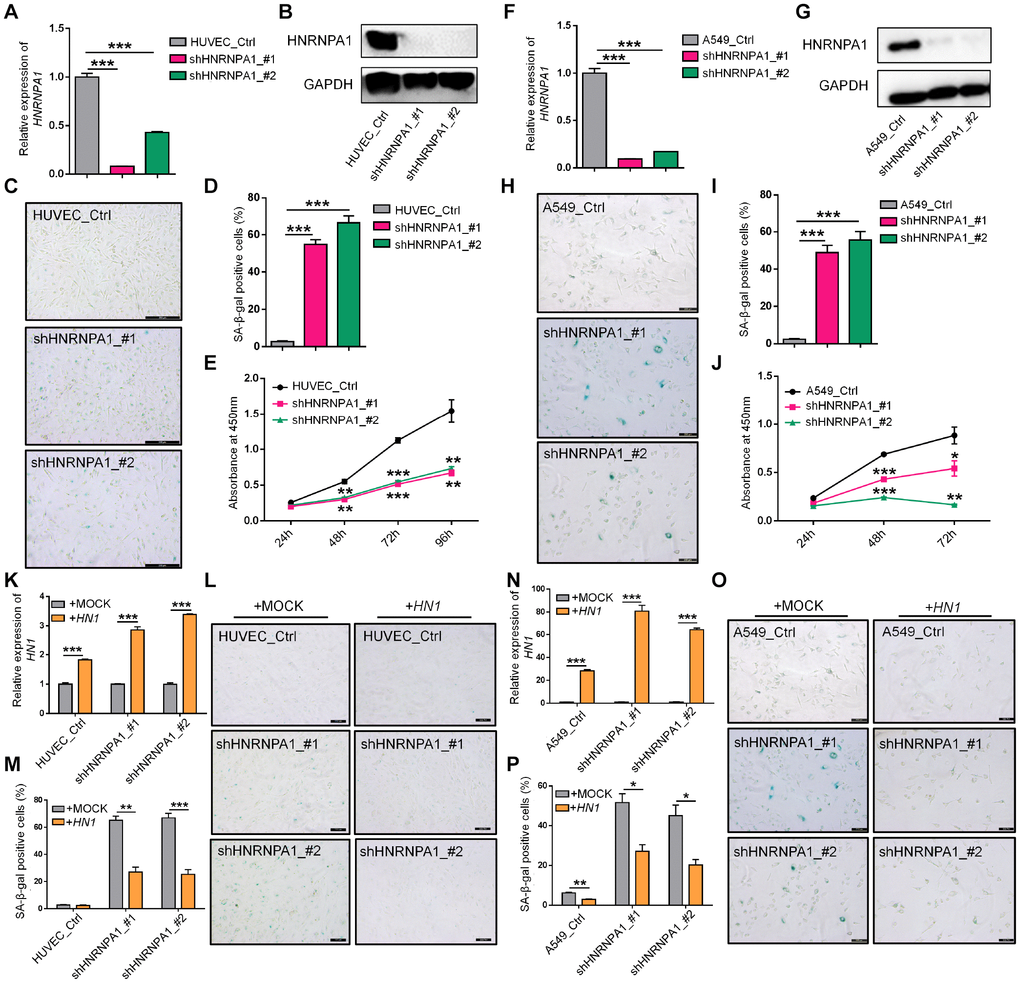
Figure 5.HNRNPA1 knockdown induces senescence-associated phenotypes and HN1 overexpression rescues HNRNPA1-KD induced SA-β-Gal activity. (A–E) Senescence-associated phenotypes were detected in HNRNPA1-KD HUVECs. HNRNPA1 knockdown by two shRNAs was validated by both qRT-PCR (A) and Western blot (B). *** represents p < 0.001 based on t-test with three qPCR reactions. SA-β-Gal staining positive cells increased (C, D) and cell proliferation rate decreased (evaluated by CCK-8 assay) (E) in HNRNPA1-KD cells. *** in D represents p < 0.001 based on t-test with three independent countings. ** and *** in E stand for p < 0.01 and p < 0.001, respectively, based on t-test with three biological replicates. (F–J) The same assays in panels A-E were performed in HNRNPA1-KD A549 cells, including mRNA levels (F), protein levels (G), SA-β-Gal staining (H, I), and CCK-8 assay (J), as described in panel A-E. *, ** and *** in J stand for p < 0.05, p < 0.01 and p < 0.001, respectively, based on t-test with three biological replicates. (K–M) Overexpression of HN1 reversed HNRNPA1-KD induced SA-β-Gal staining in HUVECs. Overexpression of HN1 was confirmed in both HNRNPA1-KD and control HUVEC cells (K). *** represents p < 0.001 based on t-test with three qPCR reactions. Representative SA-β-Gal staining (L) and staining-positive cell statistics (M) in control (+MOCK) and HN1 overexpression (+HN1) HUVECs were shown. ** and *** in M stand for p < 0.01 and p < 0.001, respectively, based on t-test with three independent countings.(N–P) Overexpression of HN1 reversed HNRNPA1-KD induced SA-β-Gal staining in A549 cells. Overexpression of HN1 was confirmed in both HNRNPA1-KD and control A549 cells (N). *** represents p < 0.001 based on t-test with three qPCR reactions. Representative SA-β-Gal staining (O) and staining-positive cell statistics (P) in control (+MOCK) and overexpression (+HN1) A549 cells were shown. * and ** in P stand for p < 0.05 and p < 0.01, respectively, based on t-test with three independent countings.