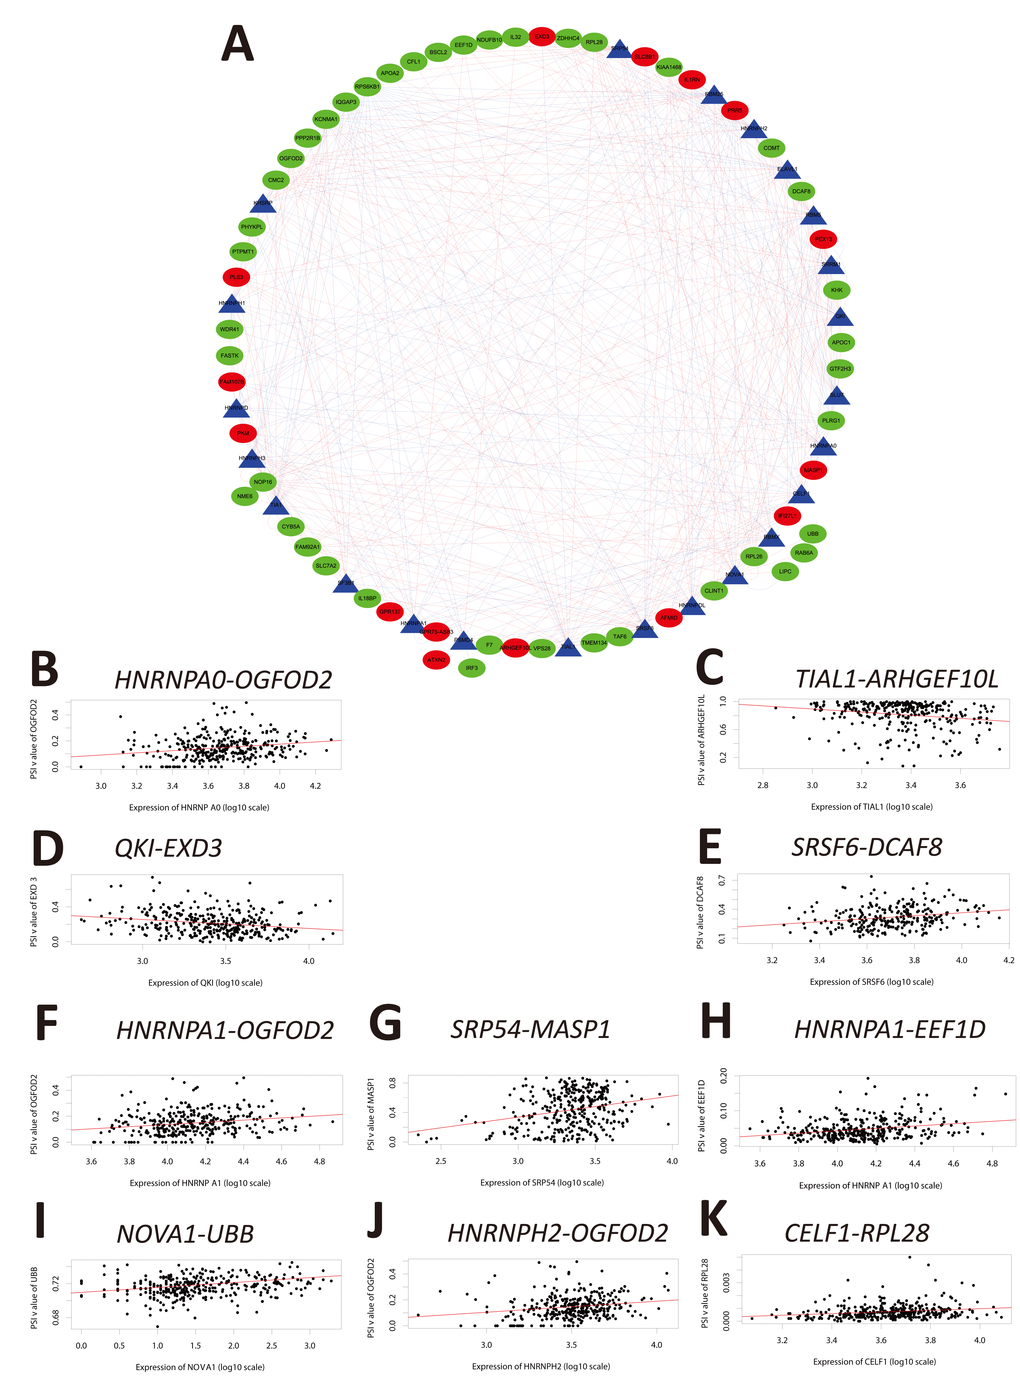
Figure 6.Correlation analysis between splicing factor expression and OS-SEs. (A) Triangles represent the splicing factors and oval nodes represent the OS-SEs. Red ovals represent the OS-SEs that displayed a positive correlation with OS while the green ovals represent OS-SEs that exhibited a negative correlation with OS. The blue and red lines indicate negative and positive correlations, respectively. (B–K) Top 10 correlations between the genes corresponding to the OS-SEs and splicing factors according to P-value.