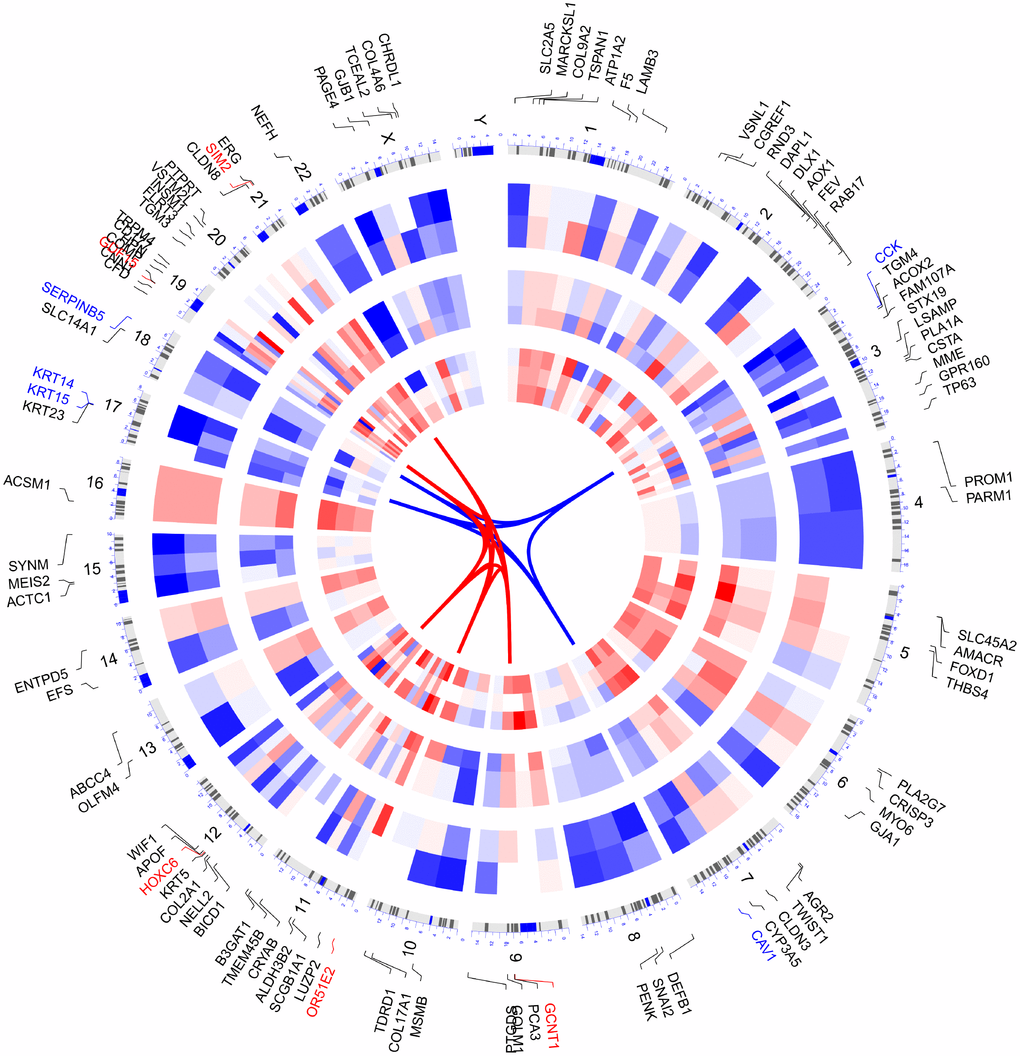
Figure 3.Circular visualization of connectivity, expression patterns, and chromosomal positions of top 100 DEGs. The 10 PCa microarray datasets from GEO are represented in the inner circular heatmaps. Red indicates gene up-regulation, blue represents downregulation, and white denotes genes not present in a given dataset. The outer circle represents chromosomes; lines coming from each gene point to their specific chromosomal locations. The top 5 up-regulated and down-regulated genes according to adjusted P are shown in red and blue and connected with red and blue lines in the center of circles.