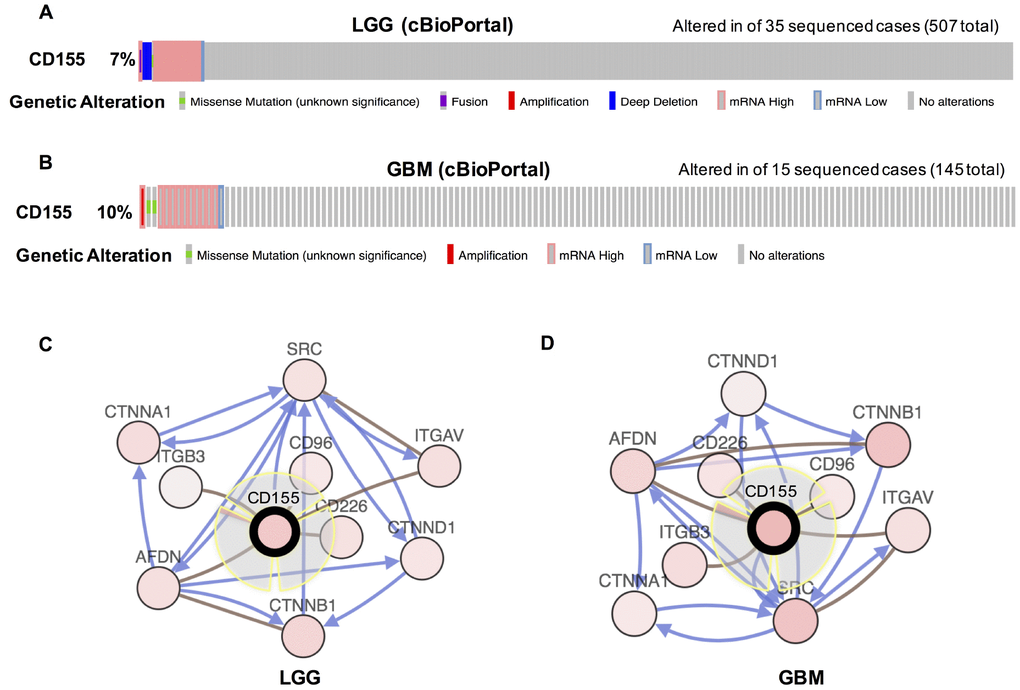
Figure 2.Visual summary of CD155 alterations and biological interaction network in gliomas (cBioPortal). An overview of genomic alterations in CD155 affecting individual samples (columns) in LGG (A) and GBM (B) from TCGA dataset was shown. Columns of different colors represent different types of genetic alterations. Results are derived from copy-number analysis algorithms like GISTIC or RAE, and indicate the copy-number level per gene. Deep Deletion indicates a deep loss, possibly a homozygous deletion. Amplification indicate a high-level amplification (more copies, often focal). Network view of the CD155 neighbor genes in LGG (C) and GBM (D) from TCGA dataset were generated. CD155 was set as seed genes (gene with black think border), and all other genes were automatically identified as altered in LGG and GBM. Derived from BioPAX: the red connection indicates that two proteins connected are members of the same complex, the blue connection indicates that the first protein controls a reaction that changes the state of the second protein.