Submit an Article
Navigate
Home
Editorial Board
Editorial Policies
Current Volume
Archive
Scientific Integrity
Publication Ethics Statements
Interviews with Outstanding Authors
Newsroom
Sponsored Conferences
Podcast
Contact
Special Collections
Submit an Article
Online ISSN: 1945-4589
Research Paper
|
Volume 11, Issue 15
|
pp. 5463–5482
Large-scale analysis reveals the specific clinical and immune features of CD155 in glioma
Back to article
Figure 5
(5 of 8)
−
100%
+
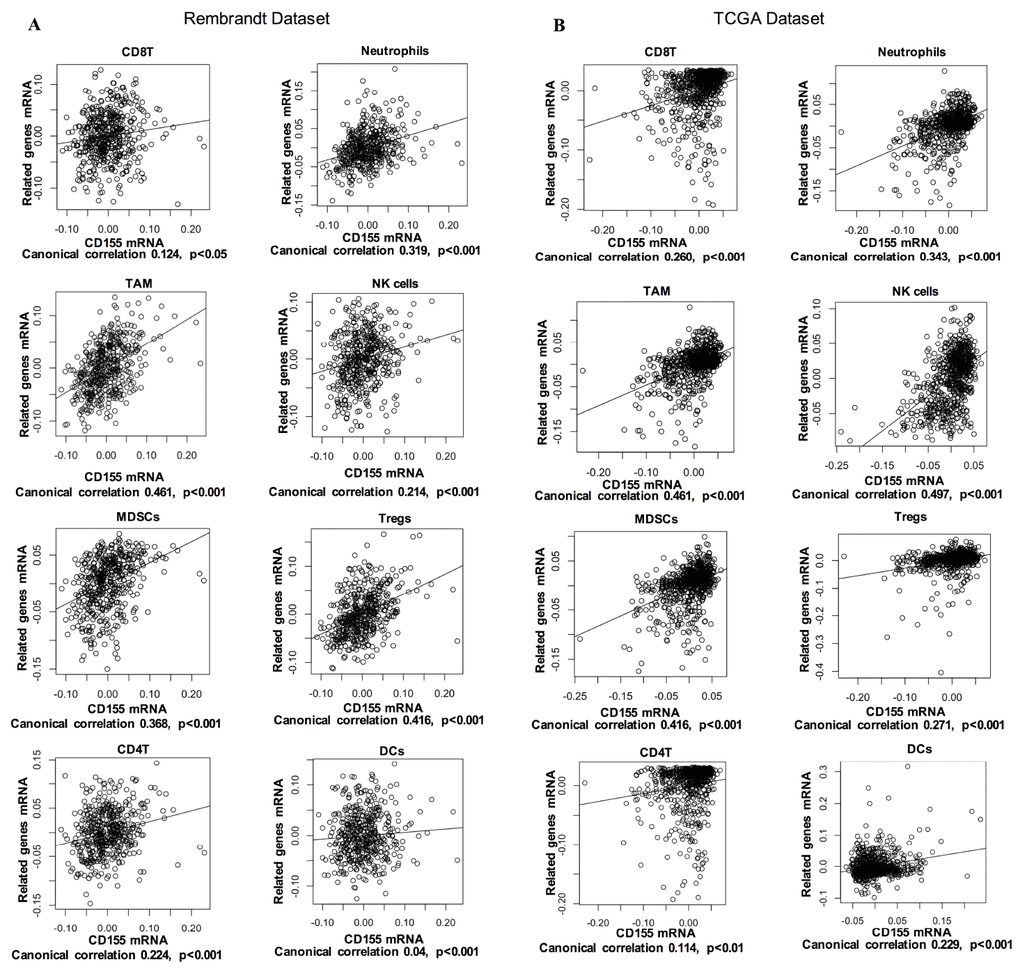
Figure 5.
Correlation of CD155 expression with immune cell-specific marker genes in Rembrandt (
A
) and TCGA (
B
) datasets. Each open circle represents a single patient with glioma. A regression line was fitted to the dot plot.