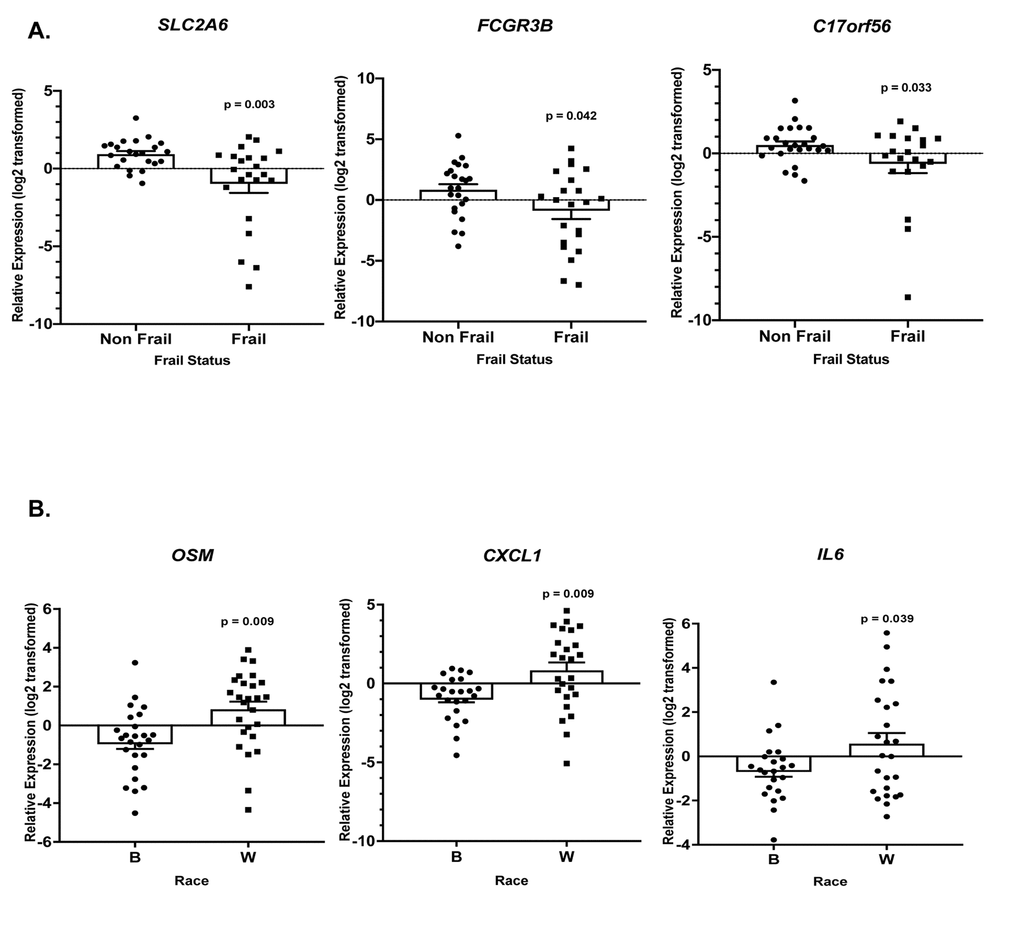
Figure 6.Frailty and race-associated changes in gene expression in the validation cohort. Total RNA was isolated from PBMCs from non-frail and frail blacks and whites in the validation cohort (Table 1B; n=52). Gene expression was analyzed using RT-qPCR with gene specific primers (Refer to Supplementary Table 6). The scatter plots show the relative expression (log2 transformed) in non-frail vs frail (A) and blacks (B) vs whites (W) in this same cohort (B). The open bars represent the mean and error bars show standard error of the mean. Significance was determined using linear regression models on the log2 transformed values.