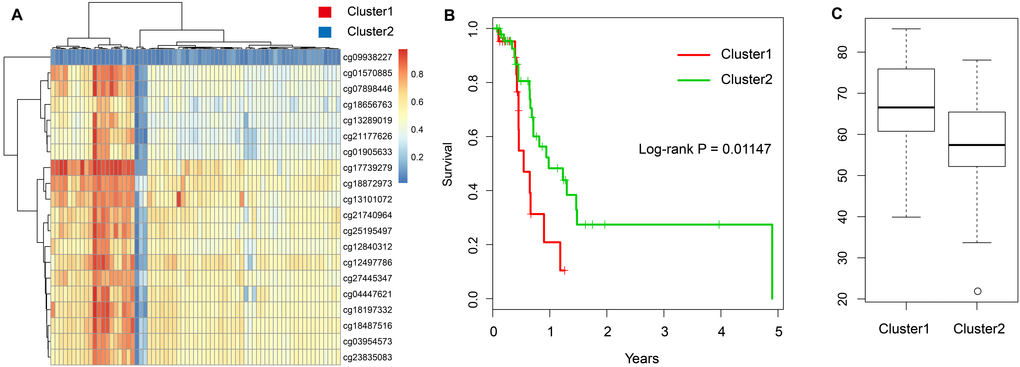
Figure 5.Construction of the prognosis risk model based on methylation genes. (A) The heatmap of 20 methylation sites in the training set. (B) The K-M plot of the hypomethylated and hypermethylated groups. (C) The age distribution of patients in the hypomethylated and hypermethylated groups.