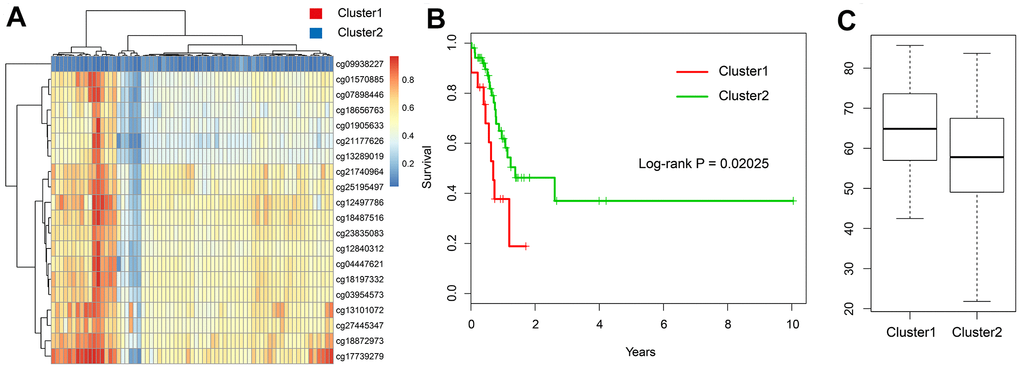
Figure 8.Validation in the TCGA testing set. (A) The heatmap of 20 methylation sites in the testing set. (B) The K-M plot of the hypomethylated and hypermethylated groups in the testing set. (C) The age distribution of patients in the hypomethylated and hypermethylated groups in the testing set.