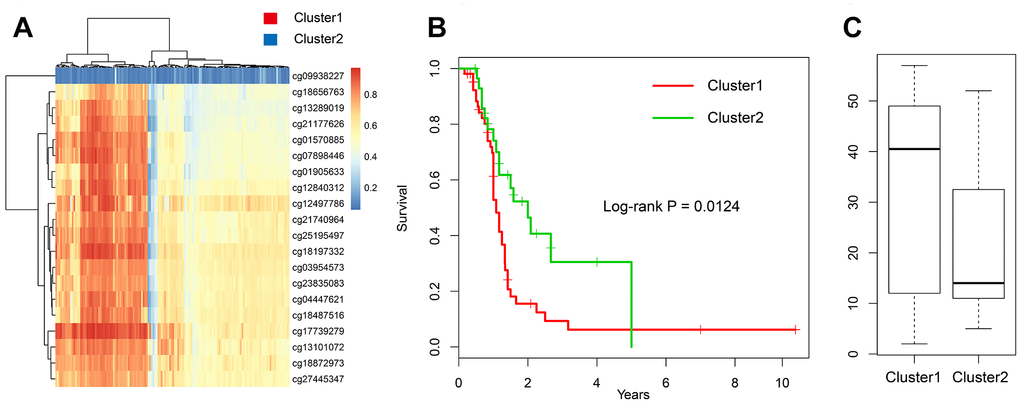
Figure 9.Validation in the GEO dataset. (A) The heatmap of 20 methylation sites in GSE36278. (B) The K-M plot of the hypomethylated and hypermethylated groups in GSE36278. (C) The age distribution of patients in the hypomethylated and hypermethylated groups in GSE36278.