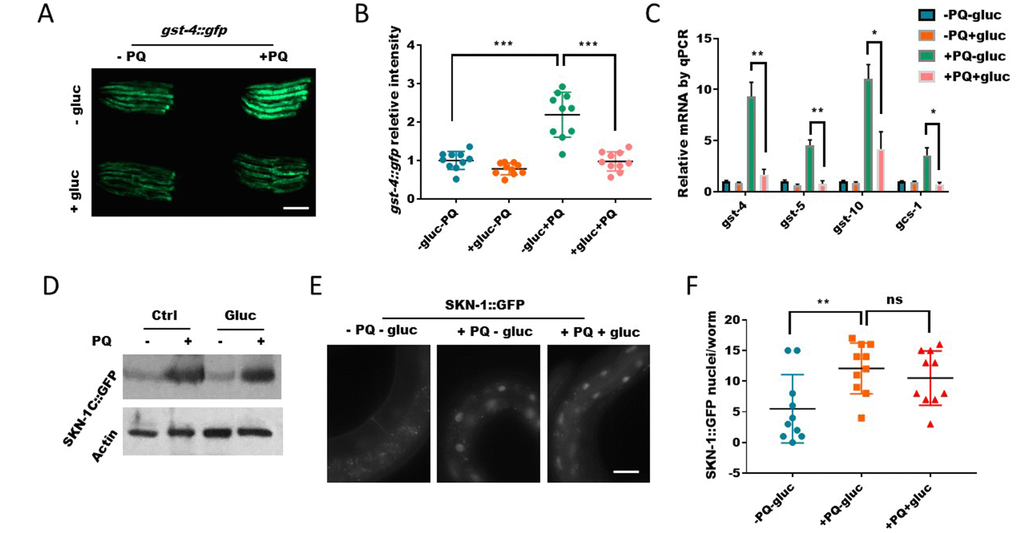
Figure 3.Glucose signal inhibits SKN-1 activity in the nucleus. (A) Glucose decreased the expression of SKN-1 target gene gst-4 as revealed by a promoter GFP fusion (gst-4::gfp). Worms expressing gst-4::gfp were raised in the absence or presence of 0.5% D-glucose to L4 stage, then transferred to NGM agar plate with or without 1mM paraquat (PQ) for 2 days. Animals were picked and imaged with fluorescent microscope. Representative images of 3 independent experiments were shown. Scale bar: 400μm. (B) Quantification of GFP signal in individual worms in experiment described in (A). Worms (n=10) were randomly selected from 3 independent experiment and GFP intensity were quantified with ImageJ software. Data were normalized to the average value of control group (-gluc-PQ). Error bars stand for standard deviation (SD). P values by student’s t-test: *** P<0.0005. (C) Glucose decreased the expression of SKN-1 target genes revealed by real-time quantitative PCR (RT-qPCR). Glucose and paraquat treatments were the same as in (A). mRNA was extracted from animals with indicated treatments then reverse-transcribed to cDNA. The abundance of cDNA of indicated gene were quantified through RT-qPCR. The mean values of 2 independent experiments were plotted and analyzed by using Prism Software, with error bars showing standard deviation (SD). P values by student’s t-test: *, P<0.05; ** P<0.005. (D) The paraquat-induced SKN-1::GFP expression were not affected by glucose. Transgenic C. elegans expressing SKN-1::GFP were treated with glucose and paraquat as in (A). Worms (n>300) were homogenized and the whole lysates were used for western blot with specific antibodies against GFP or actin. (E) The nuclear localization of SKN-1::GFP upon paraquat treatment were not affected by glucose. Transgenic C. elegans expressing SKN-1::GFP were treated with glucose and paraquat as in (A), then imaged with fluorescence microscope. Representative image of multiple experiments (n>3) were shown. Scale bar: 60μm. (F) Quantification of experimental data from E. Animals were randomly selected from multiple experiments and the fluorescence intensities were quantified by ImageJ and plotted with Prism software, with error bars showing standard deviation (SD). P values by student’s t-test: ns, not significant; ** P<0.005.