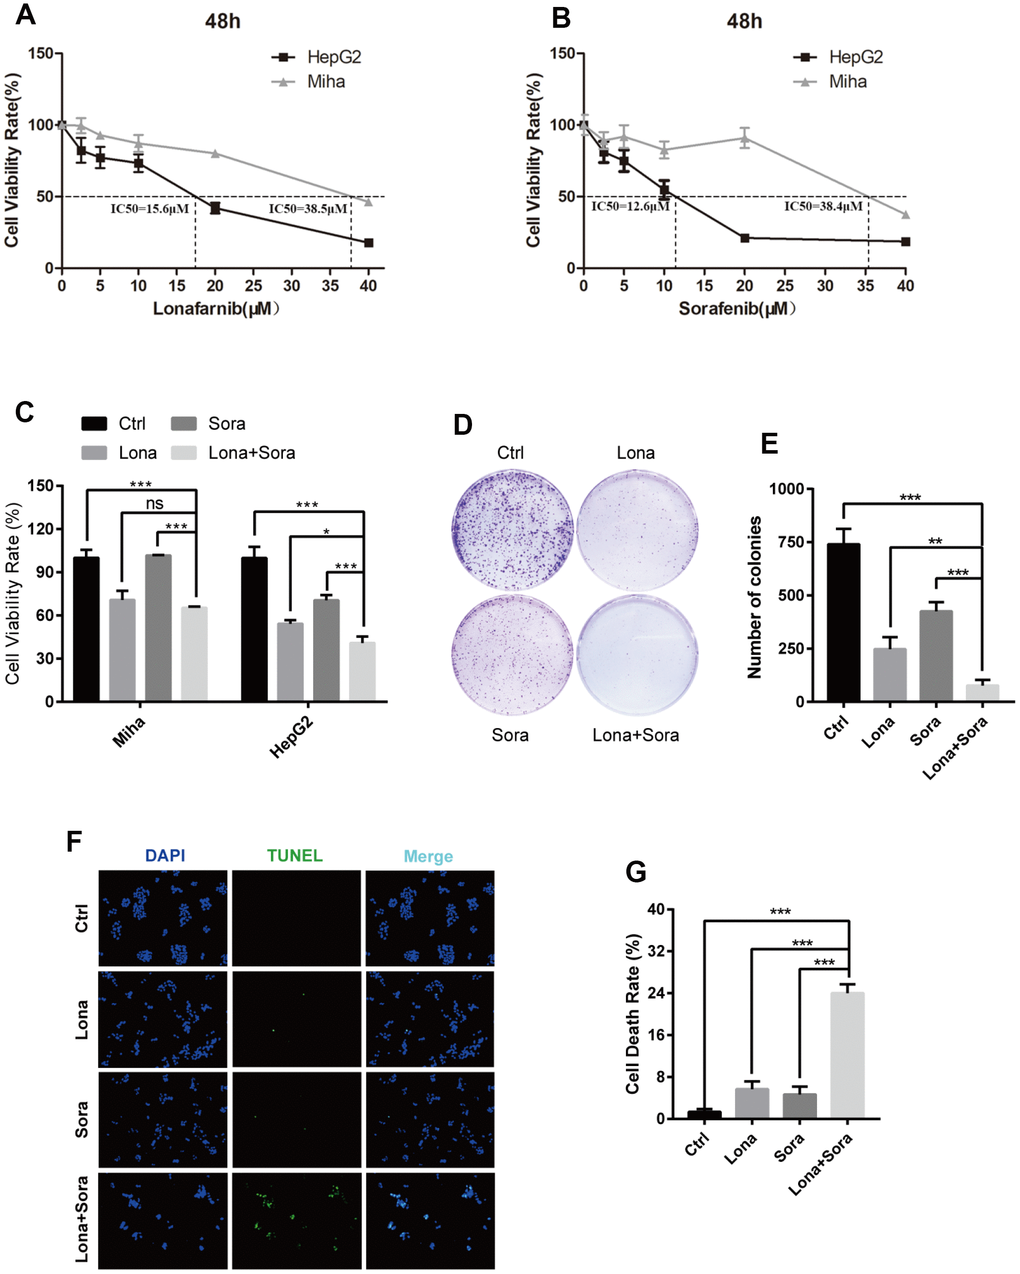
Figure 1.Combination treatment of lonafarnib and sorafenib inhibits HepG2 cell growth. (A and B) HepG2 and MIHA cells were subjected to CCK-8 assay with escalatory concentrations of lonafarnib or sorafenib. The IC50 value at 48 h was determined in these cell lines: HepG2 (lonafarnib: 15.6 μM, sorafenib: 12.6 μM), MIHA (lonafarnib: 38.5 μM, sorafenib: 38.4 μM). (C) Dose escalation effect of lonafarnib and sorafenib on the viability of HepG2 and MIHA cells measured at 48 h by CCK-8 assay. ns, P > 0.05; *P < 0.05; ***P < 0.001. (D) Colony formation assay in HepG2 cells. Cells were treated with lonafarnib (10 μM) and/or sorafenib (5 μM) for 14 days. At the end of this period, cells were stained with 0.5% crystal violet. (E) The number of colonies is calculated and presented as the means ± SD of triplicates. **P < 0.01; ***P < 0.001. (F) Representative image of TUNEL assay. HepG2 cells were maintained in 10 μM lonafarnib and/or 5 μM sorafenib for 48 h. The green puncta indicate the broken DNA fragment in cells. (G) The number of TUNEL-labeled DNA fragments were presented as the means ± SD of triplicates. ***P < 0.001.