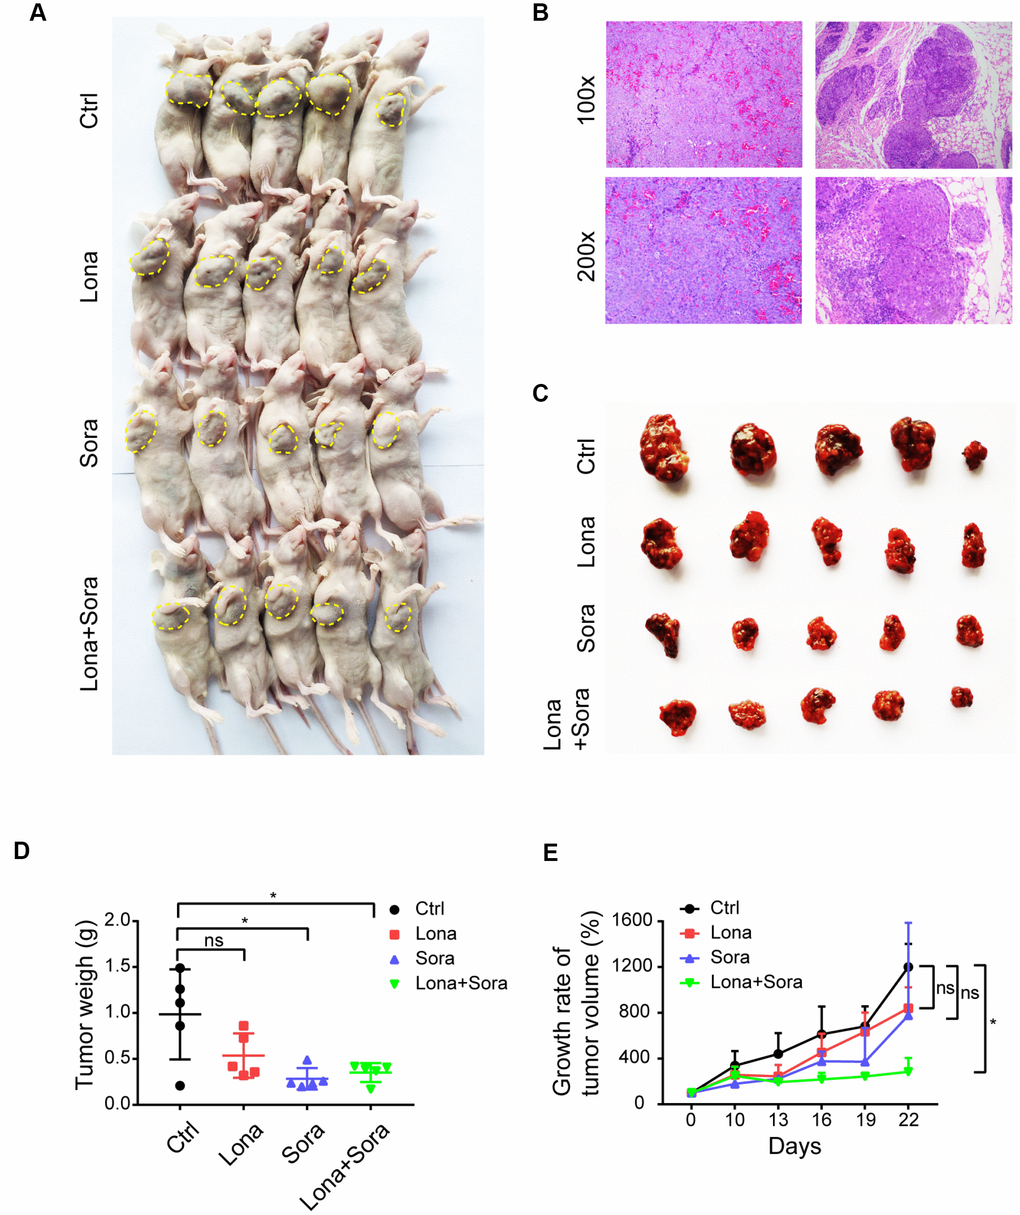
Figure 2.Co-treatment of lonafarnib and sorafenib suppresses HCC cell growth in vivo. (A) All mice used in the xenograft experiment were shown. The yellow dashed line depicts the border of palpable xenograft tumors. (B) Hematoxylin and eosin (H and E) staining of one xenograft tumor. (C) Isolated tumors from nude mice at the experimental endpoint. (D–E) Weights (D) and growth curves (E) of xenograft tumors from nude mice at the experimental endpoint. ns, P > 0.05; *P < 0.05.