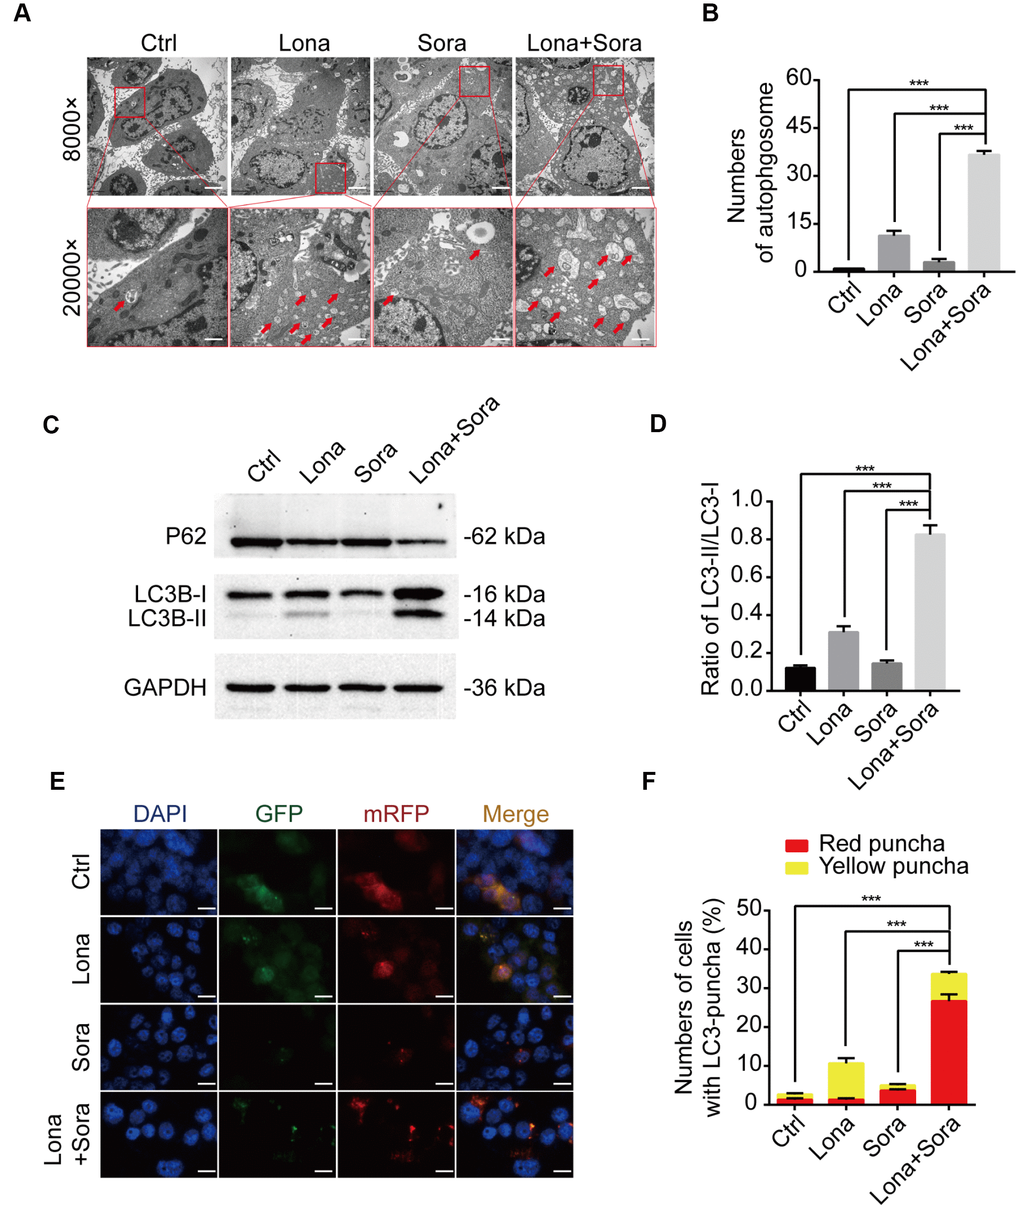
Figure 3.Lonafarnib combined with sorafenib induces autophagic flux. (A) Ultrastructural analysis showing autophagy induced by lonafarnib and sorafenib co-treatment in HepG2 cells. Red arrows indicated autophagosomes or autolysosomes. (B) The numbers of autophagosomes and autolysosomes were summarized and the data was presented as the means ± SD of triplicates. ***P < 0.001. (C) Western blot analysis of protein levels of P62 and LC3B. Cells were treated as indicated. (D) The ratio of LC3B-II/LC3B-I according to western blot results above. ***P < 0.001. (E) Detection of autophagic flux using mRFP-GFP-LC3 reporter in HepG2 cells after treatment with lonafarnib (10 μM) and/or sorafenib (5 μM) for 48 h. Microscopy images merged with GFP, RFP and DAPI fluorescence of representative cells. Scale bar = 10 μm. (F) The percentages of red (mRFP+ and GFP-, autolysosomes) and yellow (mRFP+ and GFP+, autophagosomes) were calculated. ***P < 0.001.