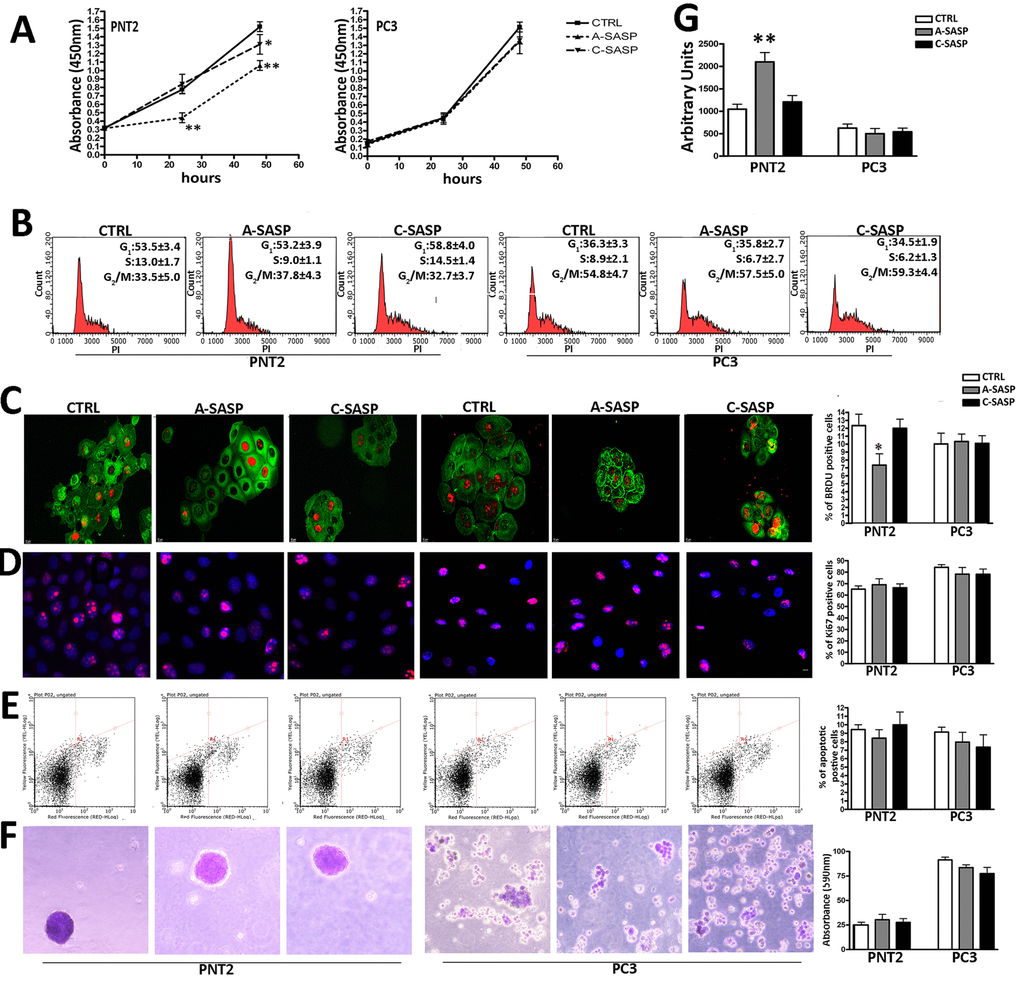
Figure 1.Responsiveness of immortalized and metastatic cancer cells to A-SASP from senescent MSCs. (A) PNT2 and PC3 cell proliferation was determined by Cell Counting Kit-8 (CCK-8) colorimetric assay (Dojindo, Germany). On the left, PNT2 proliferation in control medium (CTRL) and in media containing either an A-SASP or C-SASP. On the right, PC3 proliferation (data are expressed with standard deviation SD, n = 3, *p < 0.05; **p < 0.01). (B) Representative cell cycle FACS analysis of PNT2 and PC3 cultures treated with SASPs. (n=3 ± SD). (C) Representative micrographs of BrdU immunostaining (red) on PNT2 and PC3 cultures treated with SASPs. Cell cytoplasms were stained with actin (green). The graph shows the percentage of cycling (BrdU-positive) PNT2 and PC3 cells in the presence of different SASPs (n = 3 ± SD, *p < 0.05). (D) Representative micrographs of Ki67 immunostaining (red) on PNT2 and PC3 cultures treated with SASPs. Cell nuclei were stained with DAPI (blue). The graph shows the percentage of cycling (Ki-67-positive) PNT2 and PC3 cells in the presence of different SASPs (n = 3 ± SD). (E) Representative apoptosis FACS analysis. The experiments were carried out after treatment with SASPs. The assay allows the identification of early (Annexin V + and 7ADD −) and late apoptosis (Annexin V + and 7ADD +). The histogram shows the global percentage of Annexin V-positive cells. Data are expressed with standard deviation (n = 3 ± SD). (F) Representative micrographs of colony in suspension from PNT2 and PC3 cultures treated with SASPs. Colonies were identified by crystal violet staining. The table shows the 590 nm absorbance of crystal violet released by colonies after de-staining samples in 100% methanol (n = 3 ± SD) [26]. (G) MUG quantitative senescence assay in PNT2 and PC3 cultures. The graph shows mean percentage value of senescence. 4-MUG is a beta-galactosidase substrate that does not emit fluorescence until cleaved by the enzyme to generate the fluorophore 4-methylumbelliferone. In the different experimental conditions, weperformed an assay on cell lysates to monitor the fluorophore production; the results are shown in the graph and are expressed as arbitrary units (n = 3 ± SD **p< 0.01).
Figure 1 — The senescence-associated secretory phenotype (SASP) from mesenchymal stromal cells impairs growth of immortalized prostate cells but has no effect on metastatic prostatic cancer cells | Aging