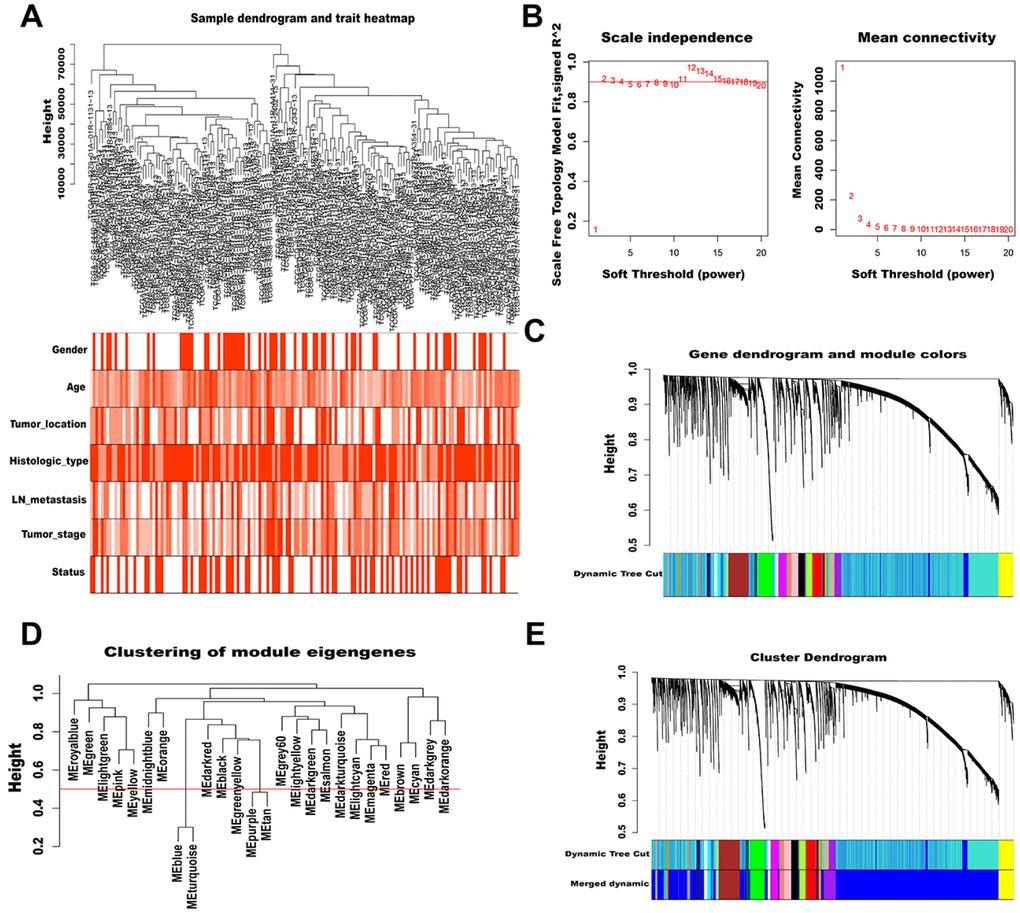
Figure 2.WGCNA of lncRNAs in AGC. (A) Sample dendrogram and trait heatmap (outliers and samples with incomplete clinical information were removed). Color depth is proportional to the strength of the correlation with clinical traits in each sample, with red and white representing highest and lowest correlation, respectively. (B) Soft-thresholding power analysis of scale independence and mean connectivity. The left graph shows the correlation coefficients that correspond to different soft-thresholding powers. The higher the coefficient, the more the network conforms to the distribution of scale-free networks. The right graph displays the mean coefficient of contiguous genes in the gene network corresponding to different soft-thresholding powers, which reflects the average connection level of the network. (C) The dynamic Tree Cut method classifies gene clustering trees. Different colors represent different gene modules, and gray indicates genes that do not belong to any known module. (D) Cluster dendrogram of module eigengenes. The value corresponding to the red line in the figure indicates the merge threshold. (E) Clustering dendrogram of genes by hierarchical clustering based on the dissimilarity TOM. Dynamic tree cut corresponds to the originally obtained module, and merged dynamic corresponds to the merged module finally obtained.