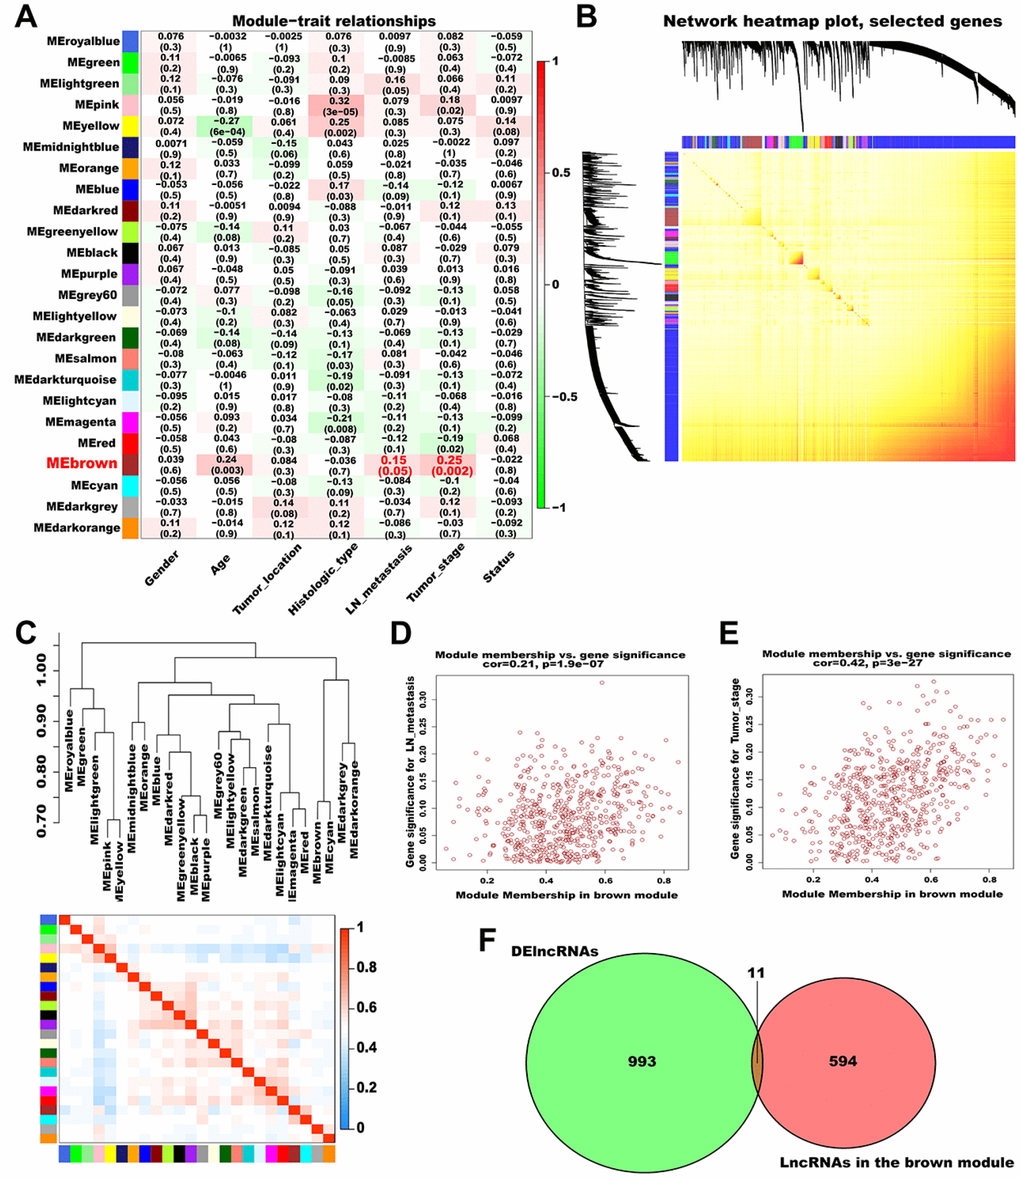
Figure 3.Identification of significant modules associated with clinical traits. (A) Relationships between module eigengenes and clinical traits of AGC. Each row in the figure corresponds to a module eigengene, and each column corresponds to a clinical trait. The correlation coefficient in each grid represents the correlation between the gene module and the clinical traits; red indicates positive correlation and green represents negative correlation. (B) TOM depicting the correlation of pairs of genes within each module. The heat map depicts the TOM from 1000 randomly selected genes from a weighted co-expression network. In the heat map, each row and column correspond to a gene; light colors indicate low topological overlap, and progressively darker yellow and red represent higher topological overlap. (C) Dendrogram heatmap of the association between modules and clinical traits. The dendrogram above shows the modules generated in the cluster analysis. Branches of the dendrogram combine positively correlated eigengenes. The heat map below shows the adjacencies in the eigengene network. Each row and column in the heat map corresponds to a module eigengene. Red indicates a positive correlation with high adjacency and blue indicates a negative correlation with low adjacency. The red square along the diagonal is the meta-module. (D) Scatter plot of MM versus GS for LN metastasis (cor = 0.21, P = 1.9e-07) in the brown module. (E) Scatter plot of MM versus GS for pathological TNM stage (cor = 0.42, P = 3e-27) in the brown module. (F) Venn plot of DElncRNAs and the lncRNAs in the brown module. Green represents the DElncRNAs and red represents the lncRNAs in the brown module.