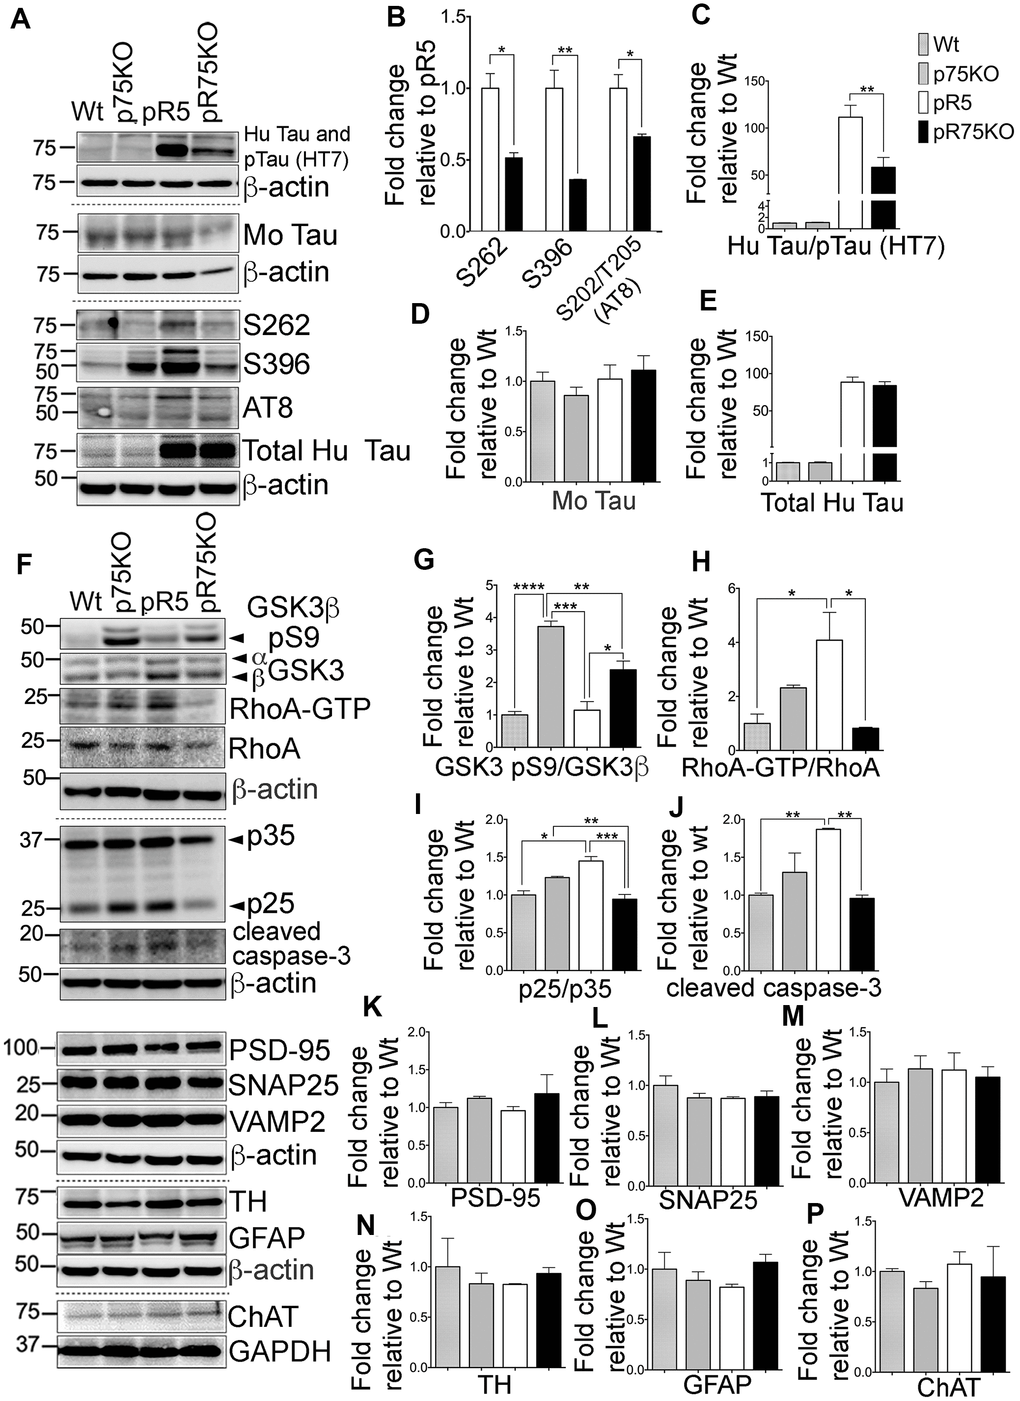
Figure 4.Knock out of p75NTR attenuated Tau hyperposphorylation and the elevated Tau kinases and caspase-3 activities observed in pR5 mice with P301L Tau at 9 months. (A) Protein blots of phosphorylated and non-phosphorylated human Tau in in the forebrain of Wt, p75KO, pR5, and pR75KO mice. (B) Protein band intensity quantification of phosphorylated human Tau at sites S262, S396 and S202/T205 (AT8) normalised to the total human Tau and expressed as fold change relative to pR5. Protein band intensity quantification of total human Tau and pTau detected by HT7 (C), total mouse Tau detected by Tau5 (D), and total human Tau detected by sheep-anti human Tau (E) normalised to β-actin and expressed as fold change relative to Wt. (F) Protein blots of kinases involved in Tau phosphorylation, GSK3, RhoA and Cdk5-activators, p25 and p35 proteins in the forebrain of Wt, p75KO, pR5, and pR75KO mice; of cleaved caspase-3; and of post-synaptic protein, PSD-95 and pre-synaptic proteins, SNAP25 and VAMP2, GFAP, TH ChAT. Protein band intensity quantification of inactive GSK3: GSK3β pS9 normalised with total GSK3β (G), active RhoA-GTP normalised with total RhoA (H), and Cdk5 activators, p25/p35 ratio (I). All band intensities showing (G–I) are expressed as fold change relative to Wt. Protein band intensity quantification of cleaved caspase-3 levels (J), PSD-95 (K), SNAP25 (L), VAMP2 (M), TH (N), GFAP (O), ChAT (P) normalized with their respective β-actin and expressed as fold change relative to Wt. Data are represented as the mean ± SEM, n=3. Statistical comparisons were performed using one-way ANOVA and Tukey’s test. For human pTau, two-tailed unpaired t-test was used to compare pR5 and pR75KO mice Statistical significance: *P<0.05, **P<0.01, ***P<0.001, ****P<0.0001.