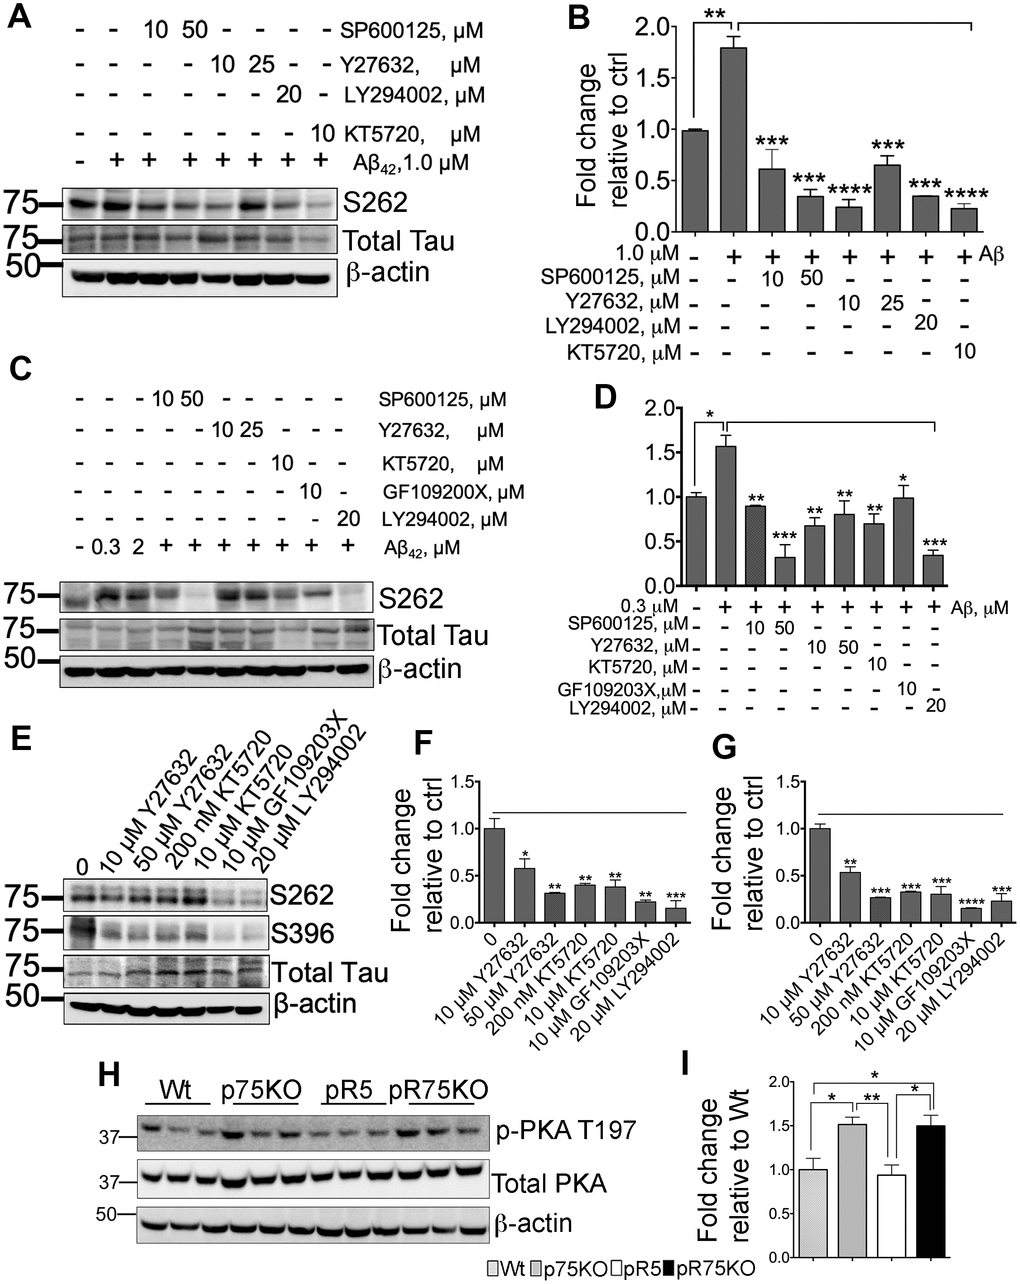
Figure 6.Various kinase inhibitors attenuated Tau hyperphosphorylation of neurons in vitro. (A) Protein blot of phosphorylated human Tau at sites S262 in SH-SY5Y-APP cell line treated with or without Aβ42 (1 μM), and subsequently treated with several kinase inhibitors for JNK (SP600125, 10 and 50 μM), ROCK (Y27632, 10 and 25 μM), PI3K (LY294002, 20 μM), and PKA (KT5720, 10 μM) in the presence of Aβ42 for 24 hours. (B) Protein band intensity quantification of phosphorylated human Tau at site S262 levels in SH-SY5Y-APP cell line. Data are represented as the mean ± SEM, n=3. (C) Protein blot of phosphorylated human Tau at sites S262 in primary cortical neurons from pR5 mice treated with or without with Aβ42 (0.3 and 2 μM), and subsequently treated with inhibitors for JNK (SP600125, 10 and 50 μM), ROCK (Y27632, 10 and 25 μM), PKA (KT5720, 10 μM), PKC (GF109203X, 10 μM) and PI3K (LY294002, 20 μM) in the presence ofAβ42 (0.3 μM). (D) Protein band intensity quantification of phosphorylated human Tau at site S262 levels in primary cortical neurons from pR5 mice normalized with total human Tau and expressed as fold change relative to non-treated control (0). Data are represented as the mean ± SEM. Experiment was done in 3 replicates, each replicate has n=12 animals. (E) Protein blot of phosphorylated human Tau at sites S262 and S396 in primary cortical neurons from pR5 mice treated with inhibitors for ROCK (Y27632, 10 and 50 μM), PKA (KT5720, 200 nM and 10 μM), PKC (GF109203X, 10 μM) and PI3K (LY294002, 20 μM). Protein band intensity quantification of phosphorylated human Tau at sites S262 (F) and S396 (G) in primary cortical neurons from pR5 mice normalized with total human Tau and expressed as fold change relative to non-treated control (0) Data are represented as the mean ± SEM. Experiment was done in 3 replicates, each replicate has n=12 animals. (H) Protein blot of PKA phosphorylated at site T197 and total PKA in 6 month old mice. (I) Protein band intensity quantification of phosphorylated PKA at site T197 normalized with total PKA and expressed as fold change relative to Wt mice. Data are represented as the mean ± SEM, n=6. Statistical comparisons were performed using one-way ANOVA and Tukey’s test. Statistical significance: *P<0.05, **P<0.01, ***P<0.001, ****P<0.0001.