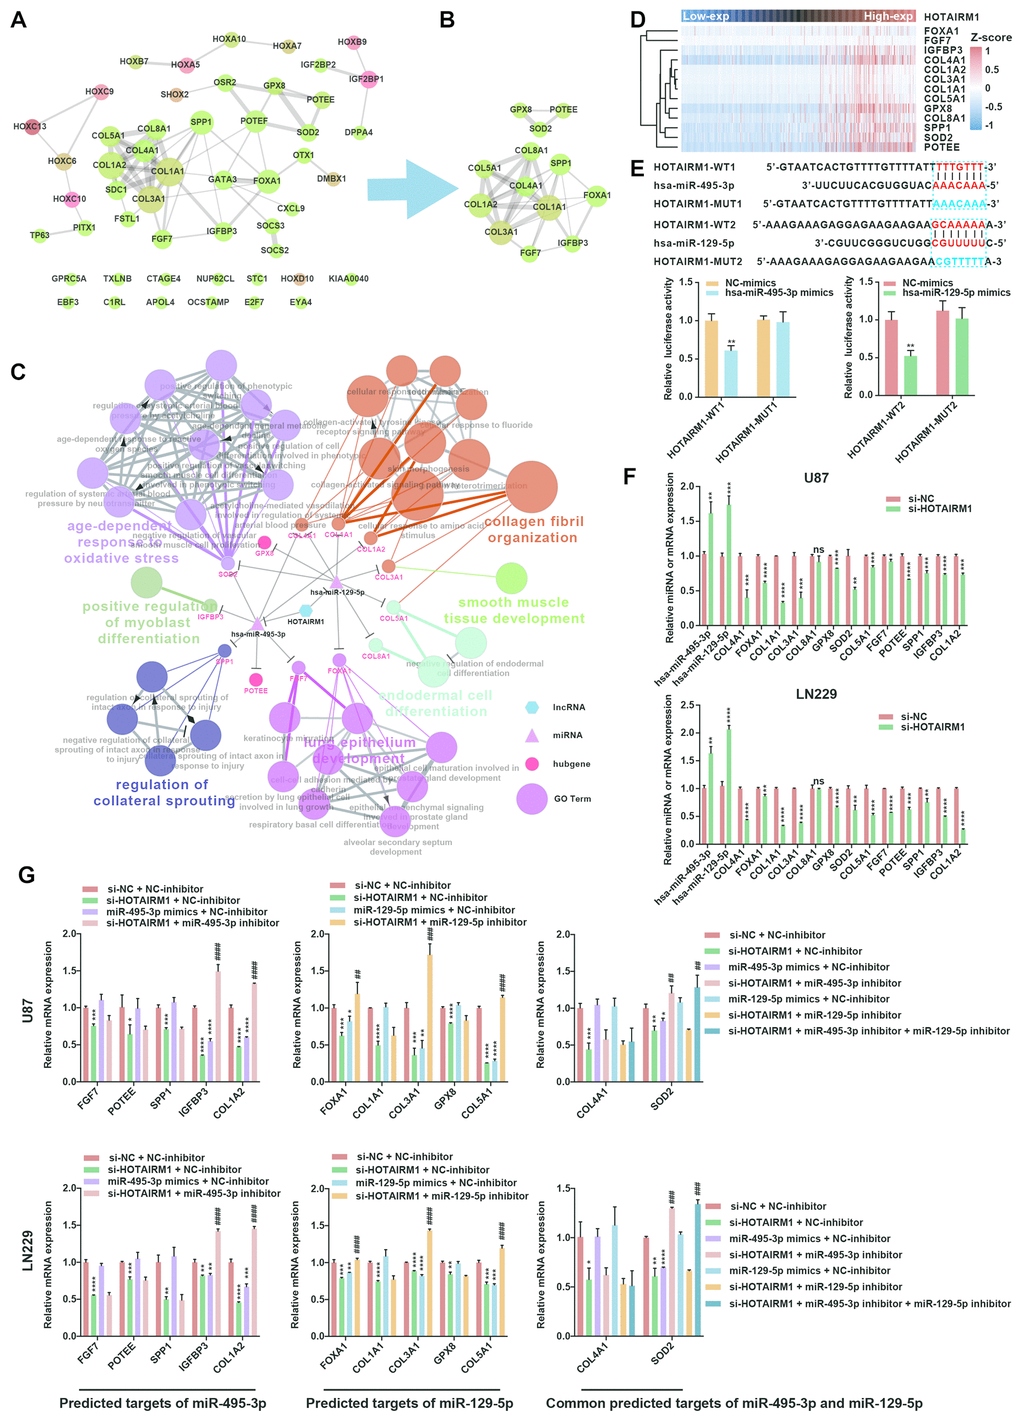
Figure 7.Construction of a HOTAIRM1–miRNA–hub gene network. (A) PPI network of 51 target genes that are closely related to HOTAIRM1 level generated using the PPI function in Cytoscape v.3.6.1. Node size increased according to the number of neighbors of each gene, and edge size changed from fine to coarse based on the combined score of two adjacent genes. (B) Subnetwork consisting of 13 hub genes extracted from (A) generated by MCODE in Cytoscape v.3.6.1. (C) Network consisting of HOTAIRM1, two miRNAs (hsa-miR-129-5p and hsa-miR-495-3p), and 13 hub genes generated with Cytoscape v.3.6.1. GO analyses of 13 hub genes was performed using ClueGO. (D) Expression profile of 13 hub genes in order of increasing HOTAIRM1 expression level in TCGA dataset. (E) Schematic representation of putative binding sites of miR-495-3p and miR-129-5p in HOTAIRM1. Relative luciferase activity was determined for HEK-293T cells co-transfected with wild-type HOTAIRM1 overexpression plasmid (HOTAIRM1-WT1) and miR-459-3p mimic or with HOTAIRM1-WT2 and miR-129-5p mimic. **P < 0.01 vs. HOTAIRM1-WT1 + negative control (NC) mimic or HOTAIRM1-WT2 + NC mimic group. (F) qRT-PCR analysis of expression levels of miR-129-5p, miR-495-3p, and 13 hub genes after HOTAIRM1 knockdown. ns, no significant difference; *P < 0.05, **P < 0.01, ***P < 0.001, ****P < 0.0001 vs. negative control siRNA (si-NC) group. (G) qRT-PCR analysis of the levels of indicated hub genes in U87 and LN229 cells after HOTAIRM1 knockdown and transfection of indicated miRNA inhibitor or mimic. *P < 0.05, **P < 0.01, ***P < 0.001, ****P < 0.0001 vs. si-NC + NC inhibitor group; ##P < 0.01, ###P < 0.001, ####P < 0.0001 vs. si-HOTAIRM1 + NC inhibitor group.