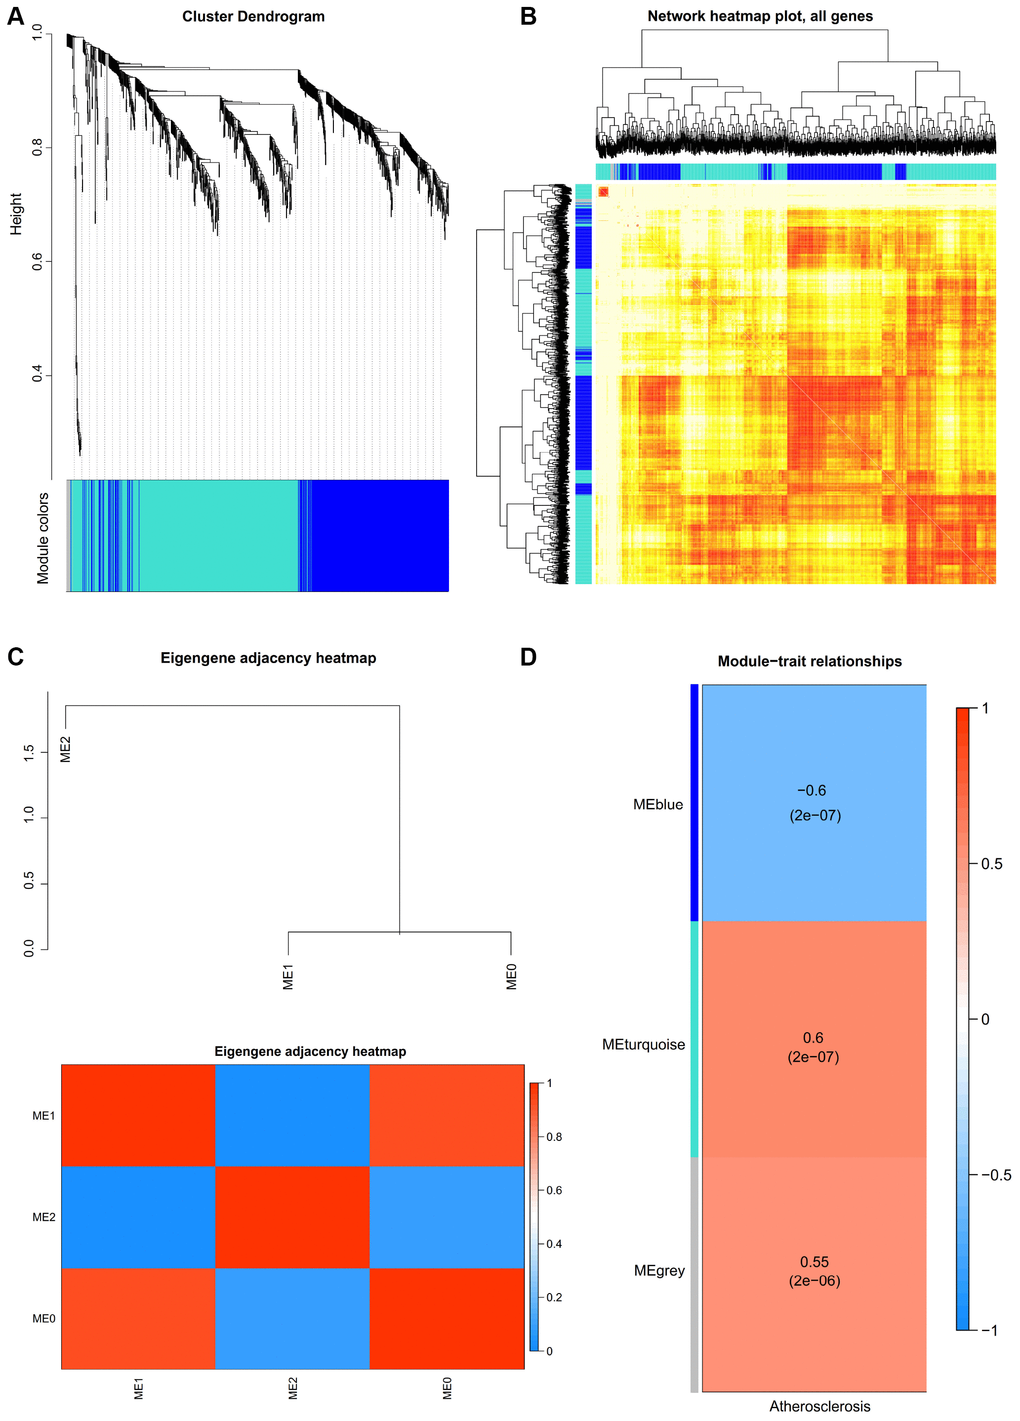
Figure 2.(A) Construction of co-expression modules by weighted gene co-expression network analysis (WGCNA) package in R. The cluster dendrogram of genes in GSE43292. Each branch in the figure represents one gene, and every color below represents one co-expression module. (B) Interaction relationship analysis of co-expression genes. Different colors of horizontal axis and vertical axis represent different modules. The brightness of yellow in the middle represents the degree of connectivity of different modules. There was no significant difference in interactions among different modules, indicating a high-scale independence degree among these modules. (C) Heatmap plot of the adjacencies in the hub gene network. (D) Heatmap of the correlation between module eigengenes and the disease status of atherosclerosis. The turquoise module was the most positively correlated with status, and the blue module was the most negatively correlated with status.