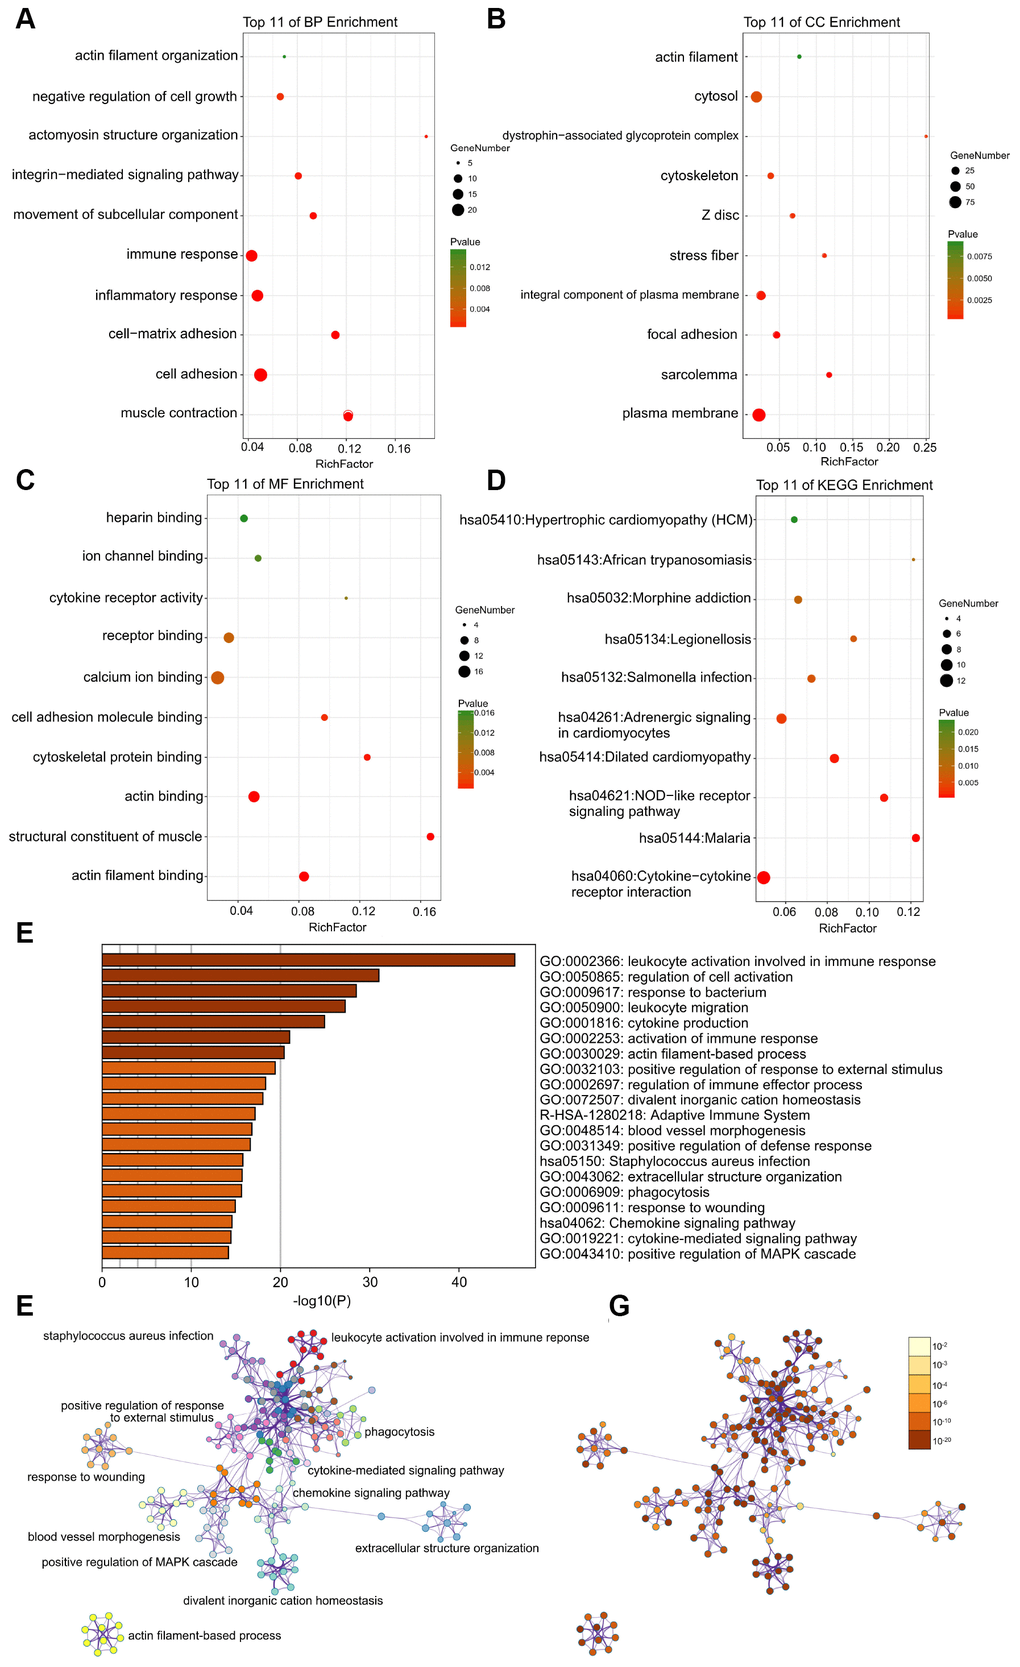
Figure 3.(A–C) Detailed information relating to changes in the biological processes (BP), cellular components (CC), and molecular functions (MF) of DEGs in atherosclerosis and control tissues through the GO enrichment analyses. (D) The KEGG pathway analysis of DEGs. KEGG, Kyoto Encyclopedia of Genes and Genomes; GO, Gene Ontology; DEGs, differentially expressed genes. (E) Heatmap of enriched terms across input differently expressed gene lists, colored by p-values, via the Metascape. (F) Network of enriched terms colored by cluster identity, where nodes that share the same cluster identity are typically close to each other. (G) Network of enriched terms colored by p-value, where terms containing more genes tend to have a more significant p-value.