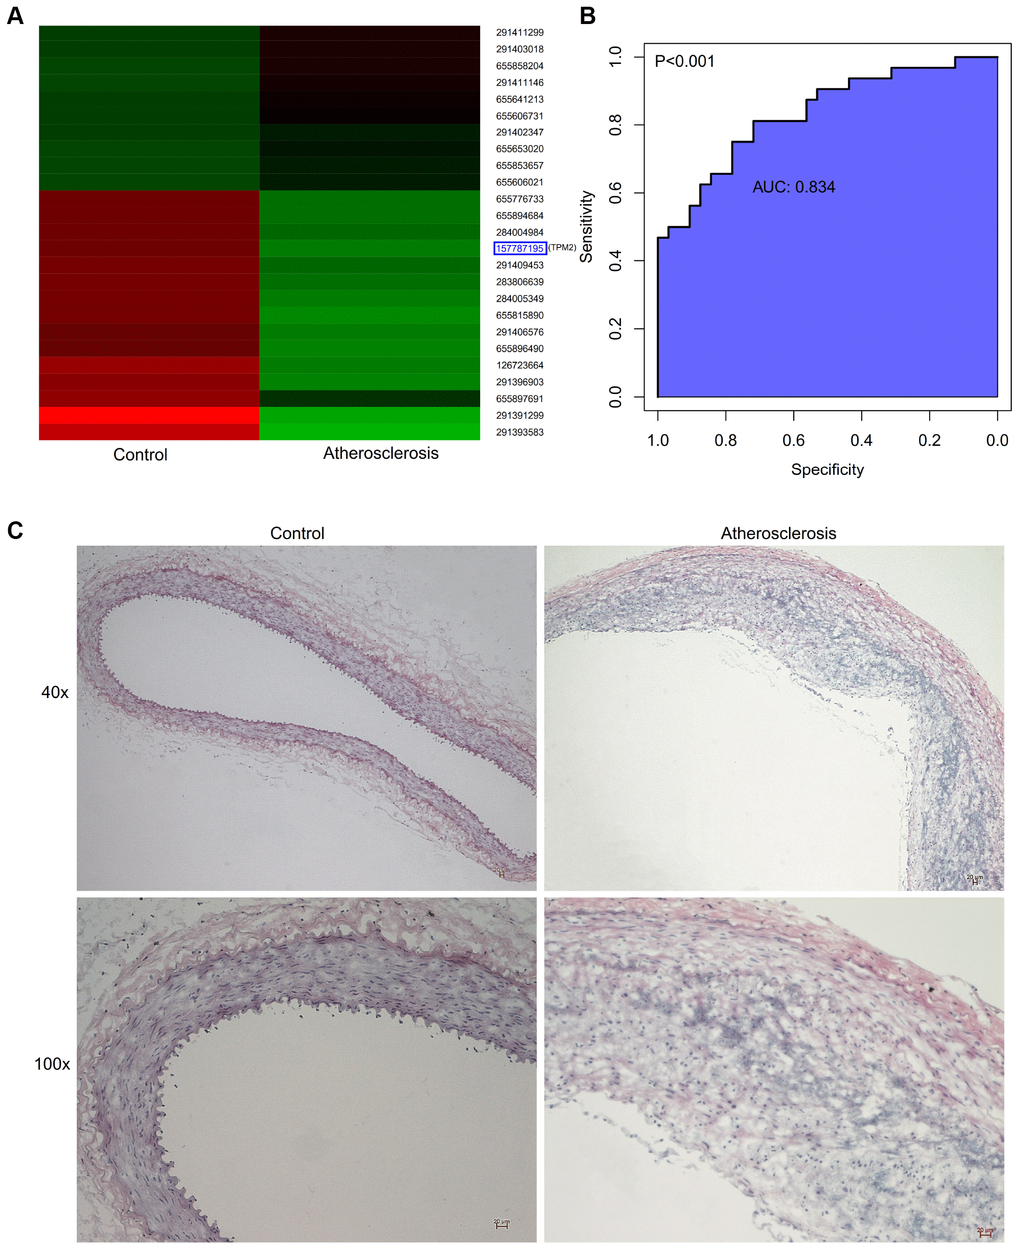
Figure 6.(A) Hierarchical clustering revealed the expression situation of DEGs between control and atherosclerotic samples in our private dataset. Upregulated genes are marked in red, downregulated genes are marked in green. The right legends represent Protein ID, where “157787195” represents TPM2. (B) The receiver operator characteristic curve, indicating that the expression level of TPM2 in the GSE43292 could predict atherosclerosis sensitively and specifically. (C) The pathological observation of artery of the control and atherosclerosis groups through the HE staining. (Gross appearance, 40x, 100x). HE: hematoxylin-eosin.