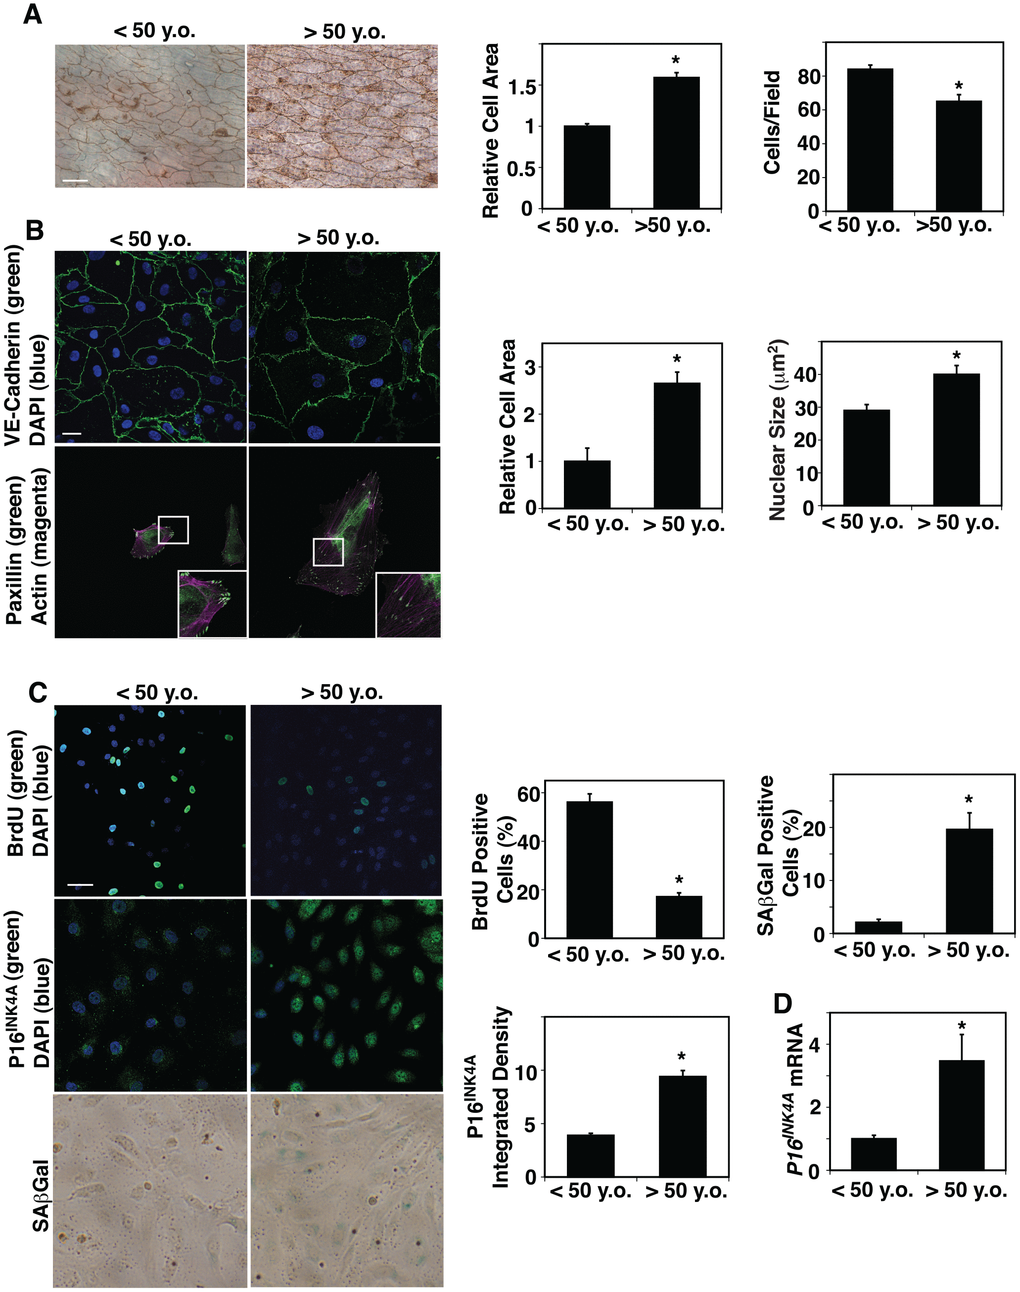
Figure 1.Age-dependent changes in human adipose EC size, proliferation and senescence. (A) Silver nitrate-stained <50 years old (<50 y.o.) and >50 years old (>50 y.o.) human adipose tissue blood vessels. Scale bar, 20 μm. Graphs showing quantification of cell area (left) and cell density (right) in blood vessels dissecting from <50 y.o. and >50 y.o. human adipose tissues (n=27, 28, mean ± s.e.m., *, p<0.05). (B) Immunofluorescence (IF) micrographs showing VE-cadherin-positive cell-cell junctions and DAPI (top) and paxillin-positive focal adhesions and actin stress fiber formation (bottom). Scale bar, 20 μm. Graphs showing quantification of cell area (left) and nuclear size (right) of ECs isolated from <50 y.o. and >50 y.o. human adipose tissues (n=5, mean ± s.e.m., *, p<0.05). (C) IF micrographs showing BrdU+ ECs isolated from <50 y.o. and >50 y.o. human adipose tissues (top). IF micrographs showing P16INK4A-positive ECs isolated from <50 y.o. and >50 y.o. human adipose tissues (middle). Micrographs showing SAβGal-stained ECs isolated from <50 y.o. and >50 y.o. human adipose tissues (bottom). Scale bar, 20 μm. Graphs showing quantification of BrdU+, P16INK4A+, and SAβGal-stained ECs isolated from <50 y.o. and >50 y.o. human adipose tissues (n=5, mean ± s.e.m., *, p<0.05). (D) Graph showing P16INK4A mRNA levels in ECs isolated from <50 y.o. and >50 y.o. human adipose tissues (n=7, mean ± s.e.m., *, p<0.05).