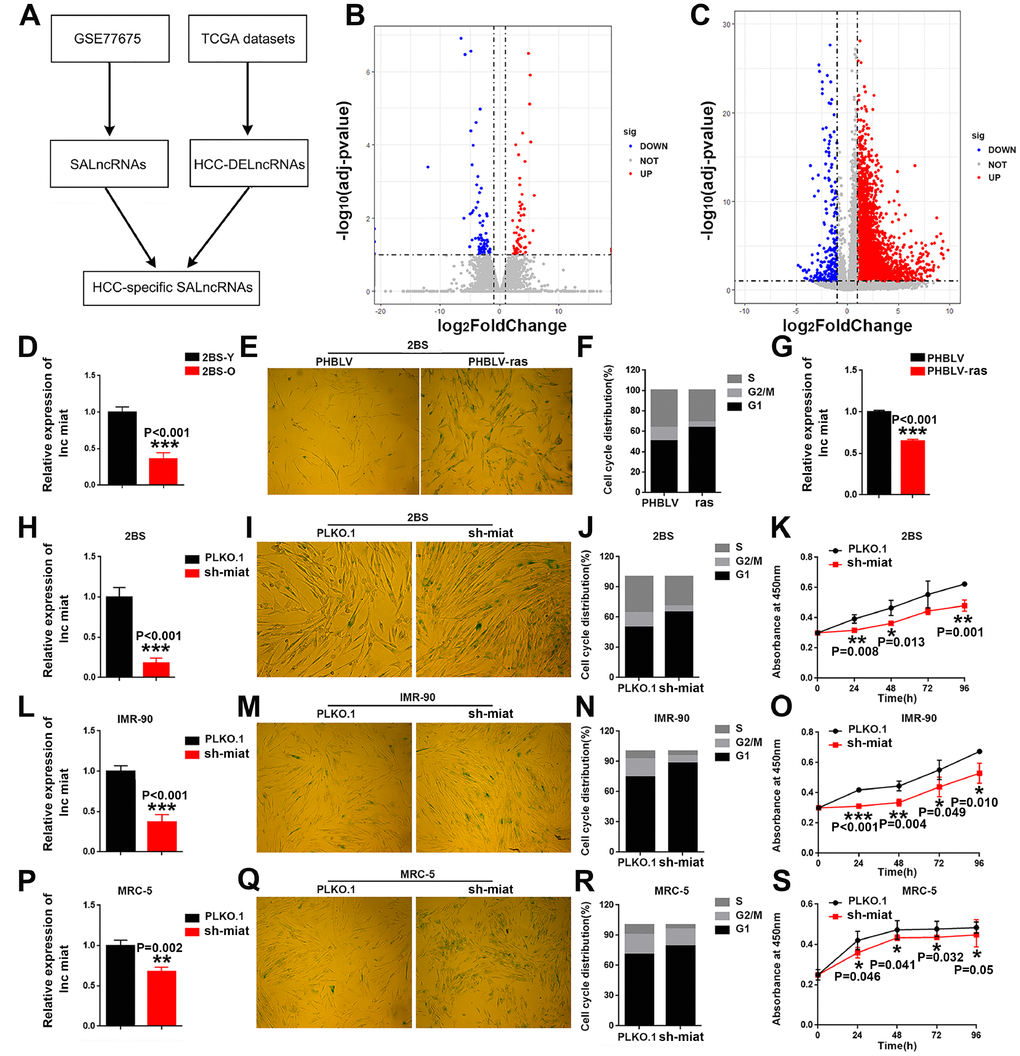
Figure 1.HCC specific SA-LncRNAs was downregulated during cellular senescence, and miat downregulation promoted cellular senescence. (A) Schematic overview of the study design. (B, C) Volcano plot of differentially expressed genes in proliferating vs. senescent WI-38 cells and HCC vs. normal tissues, respectively. The x-axis indicates log2 fold changes between the two groups and the y-axis indicates the -log10 adjusted p-value of gene expression variation. The upregulated genes are shown as red dots, the downregulated genes are shown as blue dots and the normal genes are shown as grey dots. (D) Real-time PCR analysis for miat expression in 2BS cells. The bars represent the mean and SD of three independent experiments, *P < 0.05, **P< 0.01, *** P< 0.001. (E) Cellular senescence assay by SA-β-gal staining in 2BS cells induced by the oncogene ras. (F) Cell cycle distribution analysis measured by propidium iodide staining and flow cytometry in 2BS cells induced by the oncogene ras. (G) Real-time PCR analysis for miat expression in 2BS cells induced by the oncogene ras. The bars represent the mean and SD of three independent experiments, *P < 0.05, **P< 0.01, *** P< 0.001. (H, L, P) Real-time PCR analysis for miat expression in 2BS cells, IMR-90 and MRC-5 cells transfected with the sh-miat plasmid. The bars represent the mean and SD of three independent experiments, *P < 0.05, **P< 0.01, *** P< 0.001. (I, M, Q) Cellular senescence assay by SA-β-gal staining in 2BS, IMR-90 and MRC-5 cells. (J, N, R) Cell cycle distribution analysis measured by propidium iodide staining and flow cytometry in 2BS, IMR-90 and MRC-5 cells (n=3). (K, O, S) Cell proliferation analysis determined by CCK assay (n=4, mean ± SD) in 2BS, IMR-90 and MRC-5 sh-miat cells (n =3, mean ± SD; absorption at 450 nm was detected at 0, 24, 48, 72 h and 96 h after transfection). *P < 0.05, **P< 0.01, *** P< 0.001.