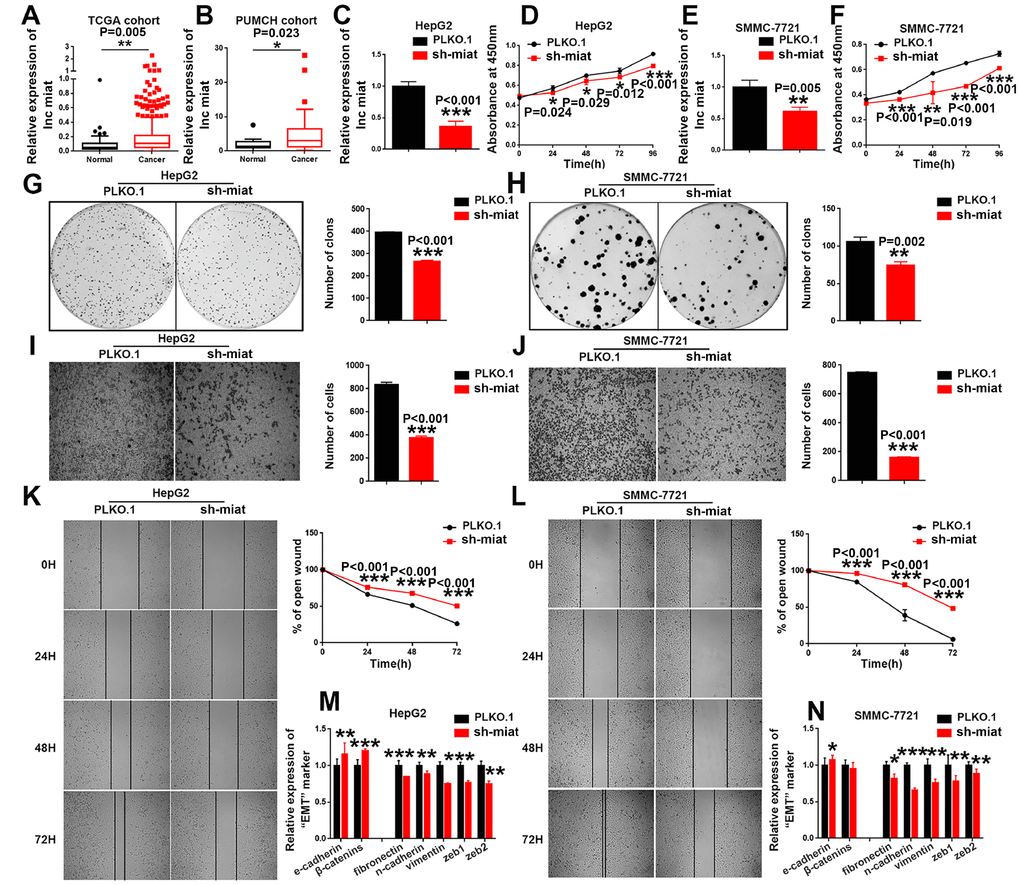
Figure 2.Knockdown of miat suppresses HCC cell hepato-carcinogenesis. (A) LncRNA miat expression analyses in HCC and nontumor tissues in TCGA datasets. *P < 0.05, **P< 0.01, *** P< 0.001. (B) LncRNA miat levels in 20 HCC and paired nontumor tissues. *P < 0.05, **P< 0.01, *** P< 0.001. (C, E) The mRNA levels of miat in miat-silenced HepG2 and SMMC-7721 cells. The bars represent the mean and SD of three independent experiments, *P < 0.05, **P< 0.01, *** P< 0.001. (D, F) Cell proliferation was measured using CCK-8 assays in HepG2 and SMMC-7721 cells with a stable knockdown of miat. The bars represent the mean and SD of three independent experiments, *P < 0.05, **P< 0.01, *** P< 0.001. (G, H) Cell colony formation assay was performed 14 days after stably knockdown miat in HepG2 and SMMC-7721 cells, and the colony number per field was calculated (right). The bars represent the mean and SD of three independent experiments, *P < 0.05, **P< 0.01, *** P< 0.001. (I, J) Transwell assay showing that knockdown of miat reduced the migration of HepG2 and SMMC-7721 cells. Representative images of the migratory cells were captured 28 h after the cells were inoculated; *P < 0.05, **P< 0.01, *** P< 0.001. (K, L) The wound-healing assay demonstrated that miat silencing reduced the migration of HepG2 and SMMC-7721 cells. Representative images were captured at 0 h, 24 h, 48 h and 72 h after scratching. The wound closure distance was measured with the software from the Leica Application Suite. The bars represent the mean and SD of three independent experiments, *P < 0.05, **P< 0.01, *** P< 0.001. (M, N) Real-time PCR analysis of the mRNA levels of key EMT markers was performed in HepG2 and SMMC-7721 cells with a stable knockdown of miat. The bars represent the mean and SD of three independent experiments, *P < 0.05, **P< 0.01, *** P< 0.001.