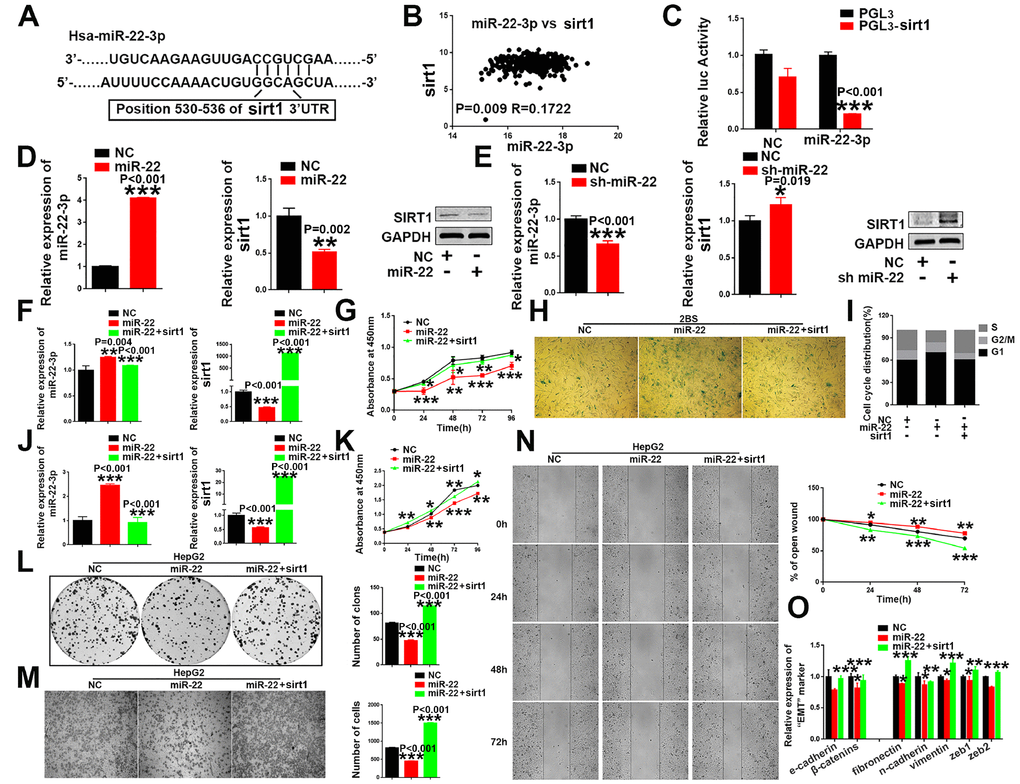
Figure 5.sirt1 is a downstream target of miR-22-3p. (A) Schematic representation of miR-22-3p predicted binding site in the 3′-UTR of sirt1 mRNAs. (B) Spearman's correlation coefficient analysis of miat and miR-22-3p expression in TCGA database. (C) Sirt1 cDNA was cloned downstream of the luciferase gene (PGL3-sirt1) and transfected into HepG2 cells with miR-22-3p or NC. Luciferase activity was detected 48 h after transfection. The bars represent the mean and SD of three independent experiments, *P < 0.05, **P< 0.01, *** P< 0.001. (D) The mRNA and protein levels of sirt1 were decreased when HepG2 cells were transfected with miR-22-3p (miR-22). The bars represent the mean and SD of three independent experiments, *P < 0.05, **P< 0.01, *** P< 0.001. (E) The mRNA and protein levels of sirt1 were increased when HepG2 cells were transfected with the miR-22-3p inhibitor (sh-miR-22). Data are expressed as the mean ± SD. n=3. *P < 0.05, **P < 0.01 and ***P < 0.001compared with the control group. (F) The mRNA levels of miR-22-3p and sirt1 in 2BS cells infected with the NC, miR-22-3p or co-infected with the miR-22-3p with sirt1. The bars represent the mean and SD of three independent experiments, *P < 0.05, **P< 0.01, *** P< 0.001. (G) Cell proliferation was measured using CCK-8 assays in 2BS cells infected with the NC, miR-22-3p or co-infected with the miR-22-3p with sirt1. Data are expressed as the mean ± SD. n=4. *P < 0.05, **P < 0.01 and ***P < 0.001compared with the control group. (H) Cellular senescence assay by SA-β-gal staining in 2BS cells infected with the NC, miR-22-3p or co-infected with the miR-22-3p with sirt1. (I) Cell cycle assays were performed in 2BS cells infected with the NC, miR-22-3p or co-infected with the miR-22-3p with sirt1. (J) The mRNA levels of miR-22-3p and sirt1 in HepG2 infected with the NC, miR-22-3p or co-infected with the miR-22-3p with sirt1. The bars represent the mean and SD of three independent experiments, *P < 0.05, **P< 0.01, *** P< 0.001. (K) Cell proliferation was measured using CCK-8 assays in HepG2 cells infected with the NC, miR-22-3p or co-infected with the miR-22-3p with sirt1. The bars represent the mean and SD of three independent experiments, *P < 0.05, **P< 0.01, *** P< 0.001. (L) Cell colony formation assay was performed 14 days after HepG2 cells were infected with the NC, miR-22-3p or co-infected with the miR-22-3p with sirt1. The bars represent the mean and SD of three independent experiments; *P < 0.05, **P< 0.01, *** P< 0.001. (M) Transwell assays were captured 24 h after the cells were inoculated, and the results are summarized in the right panel. The bars represent the mean and SD of three independent experiments; *P < 0.05, **P< 0.01, *** P< 0.001. (N) Representative images of the HepG2 cell wound-healing assay were captured at 0, 24, 48 and 72 h after scratching. The wound closure distance was measured with the software from the Leica Application Suite. The bars represent the mean and SD of three independent experiments; *P < 0.05, **P < 0.01 and ***P < 0.001. (O) RT-PCR assay of EMT markers was performed in HepG2 cells infected with the NC, miR-22-3p or co-infected with the miR-22-3p with sirt1; *P < 0.05, **P < 0.01 and ***P < 0.001.