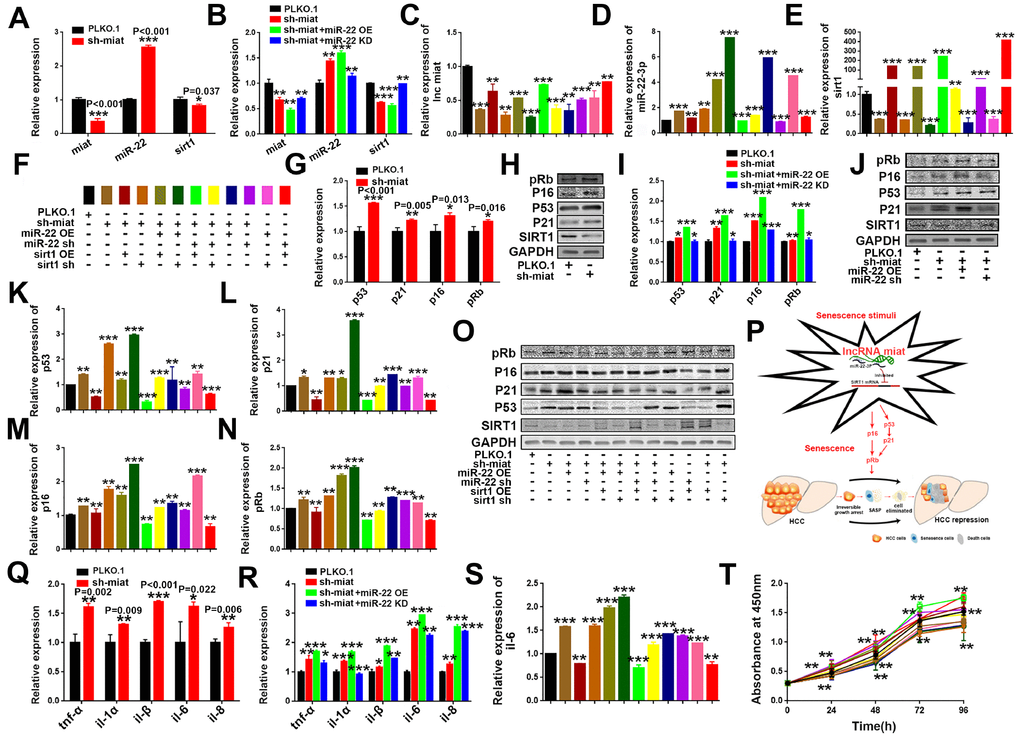
Figure 6.LncRNA miat silencing activates the p53/p21 and p16/pRb signaling pathways and promotes the production of SASP in HepG2 cells. (A) RT-PCR analysis for the expression levels of miat, miR-22-3p and sirt1 in sh-miat HepG2 cells. The bars represent the mean and SD of three independent experiments; *P < 0.05, **P < 0.01 and ***P < 0.001. (B) RT-PCR analysis for the expression levels of miat, miR-22-3p and sirt1 in HepG2 cells infected with PLKO.1, sh-miat, or co-infected with sh-miat with the miR-22-3p (miR-22 OE) /miR-22-3p inhibitor (miR-22 KD). The bars represent the mean and SD of three independent experiments; *P < 0.05, **P < 0.01 and ***P < 0.001. (C–E) RT-PCR analysis for the expression levels of miat, miR-22-3p and sirt1 in HepG2 cells with different treatments. The bars represent the mean and SD of three independent experiments; *P < 0.05, **P < 0.01 and ***P < 0.001. (F) The specific color corresponding to different experimental groups in Figure 6C–6E, 6K–6N, 6S, 6T. (G) RT-PCR analysis of the expression levels of the p53/p21 and p16/pRb signaling pathways in sh-miat HepG2 cells. The bars represent the mean and SD of three independent experiments; *P < 0.05, **P < 0.01 and ***P < 0.001. (H) The protein levels of sirt1, p53/p21 and p16/pRb were measured by western blotting. (I) RT-PCR analysis for the expression levels of the p53/p21 and p16/pRb signaling pathway in HepG2 cells infected with PLKO.1, sh-miat, or co-infected with sh-miat with the miR-22-3p (miR-22 OE) /miR-22-3p inhibitor (miR-22 KD). The bars represent the mean and SD of three independent experiments; *P < 0.05, **P < 0.01 and ***P < 0.001. (J) Protein levels of sirt1, p53/p21 and p16/pRb were measured by western blotting in HepG2 cells infected with PLKO.1, sh-miat, or co-infected with sh-miat with the miR-22-3p (miR-22 OE) /miR-22-3p inhibitor (miR-22 KD). (K–N) RT-PCR analysis for the expression levels of the p53/p21 and p16/pRb signaling pathway in HepG2 cells with different treatments as described in Figure 6F. The bars represent the mean and SD of three independent experiments; *P < 0.05, **P < 0.01 and ***P < 0.001. (O) Protein levels of sirt1, p53/p21 and p16/pRb were measured by western blotting in HepG2 cells with different treatments. (P) Schematic overview of the study design. (Q) RT-PCR analysis for the expression of selected SAS P components (tnf-α, il-1α, il-1β, il-6 and il-8) was analyzed by quantitative PCR in sh-miat HepG2 cells. The bars represent the mean and SD of three independent experiments; *P < 0.05, **P < 0.01 and ***P < 0.001. (R) RT-PCR analysis for the expression of selected SASP components (tnf-α, il-1α, il-1β, il-6 and il-8) was analyzed by quantitative PCR in HepG2 cells infected with PLKO.1, sh-miat, or co-infected with sh-miat with the miR-22-3p (miR-22 OE) /miR-22-3p inhibitor (miR-22 KD). The bars represent the mean and SD of three independent experiments; *P < 0.05, **P < 0.01 and ***P < 0.001. (S) RT-PCR analysis for the expression of selected SASP components. il-6 was analyzed by quantitative PCR in HepG2 cells with different treatments. The bars represent the mean and SD of three independent experiments; *P < 0.05, **P < 0.01 and ***P < 0.001. (T) Cell proliferation was measured using CCK-8 assays in HepG2 cells with different treatments; n=4, *P < 0.05, **P < 0.01 and ***P < 0.001.