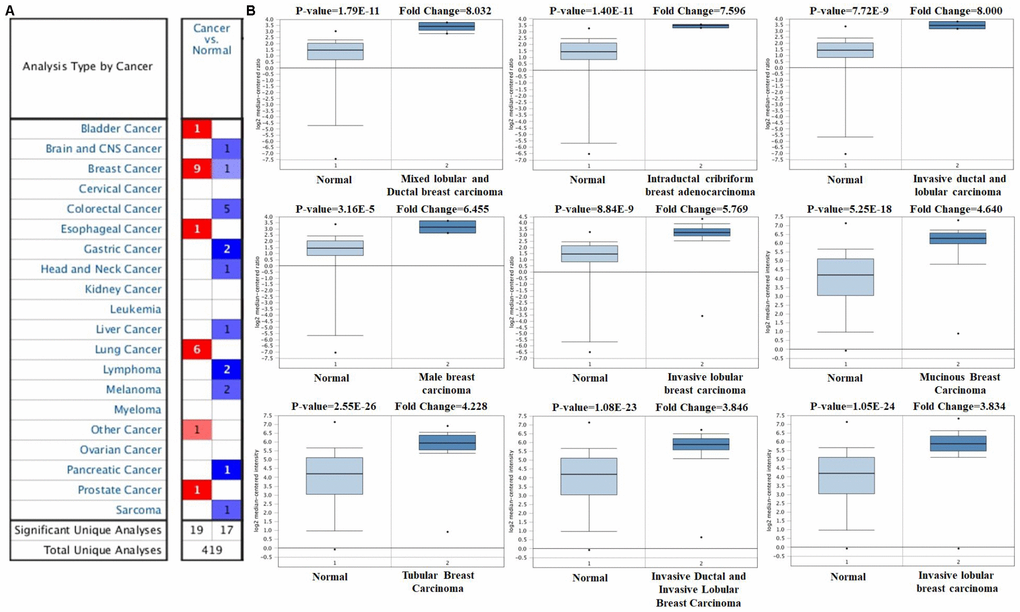
Figure 3.FOXA1 analysis in breast cancer (Oncomine database). The online Oncomine analysis tool (red: overexpression, blue: down-expression) was used to compare FOXA1 expression levels in breast cancer specimens with matched normal specimens. The thresholds for significant probes for each microarray dataset included a two-fold difference in expression between cancer and normal samples and P < 0.0001. The box plot compares FOXA1 expression in cancer samples (right) and matches normal (left) samples generated from the Oncomine database.