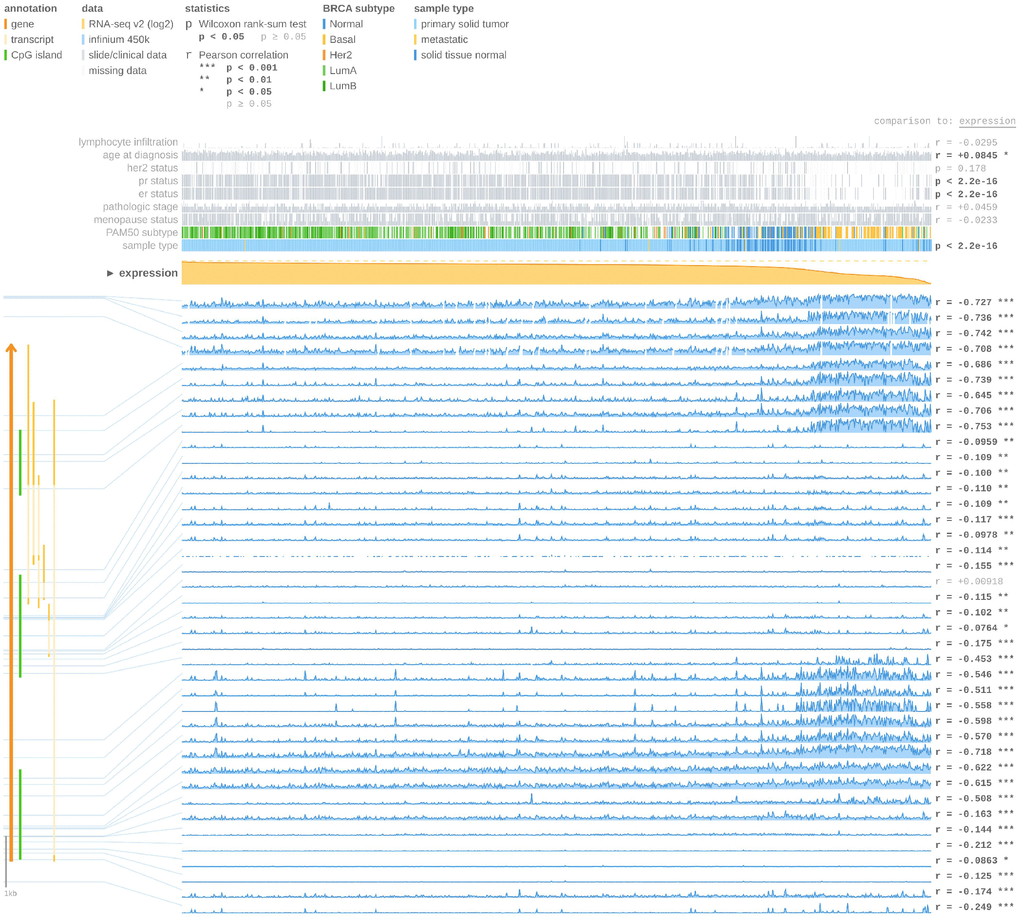
Figure 9.FOXA1 expression and methylation status in breast cancer using MEXPRESS tool. At the top of the figure, clinical TGCA data is displayed and classified according to FOXA1 expression. On the right side, the Pearson’s correlation coefficient r and p values for Wilcoxon rank-sum test are displayed. The FOXA1 expression is represented by the orange line in the center of the graph. According to the expression of FOXA1, the highest expression was found on the left side and the lowest on the right side. The blue lines (lower right) represent the Infinium 450 k probes linked to FOXA1. FOXA1 gene and CpG islands (green lines) are displayed on the left side (bottom).