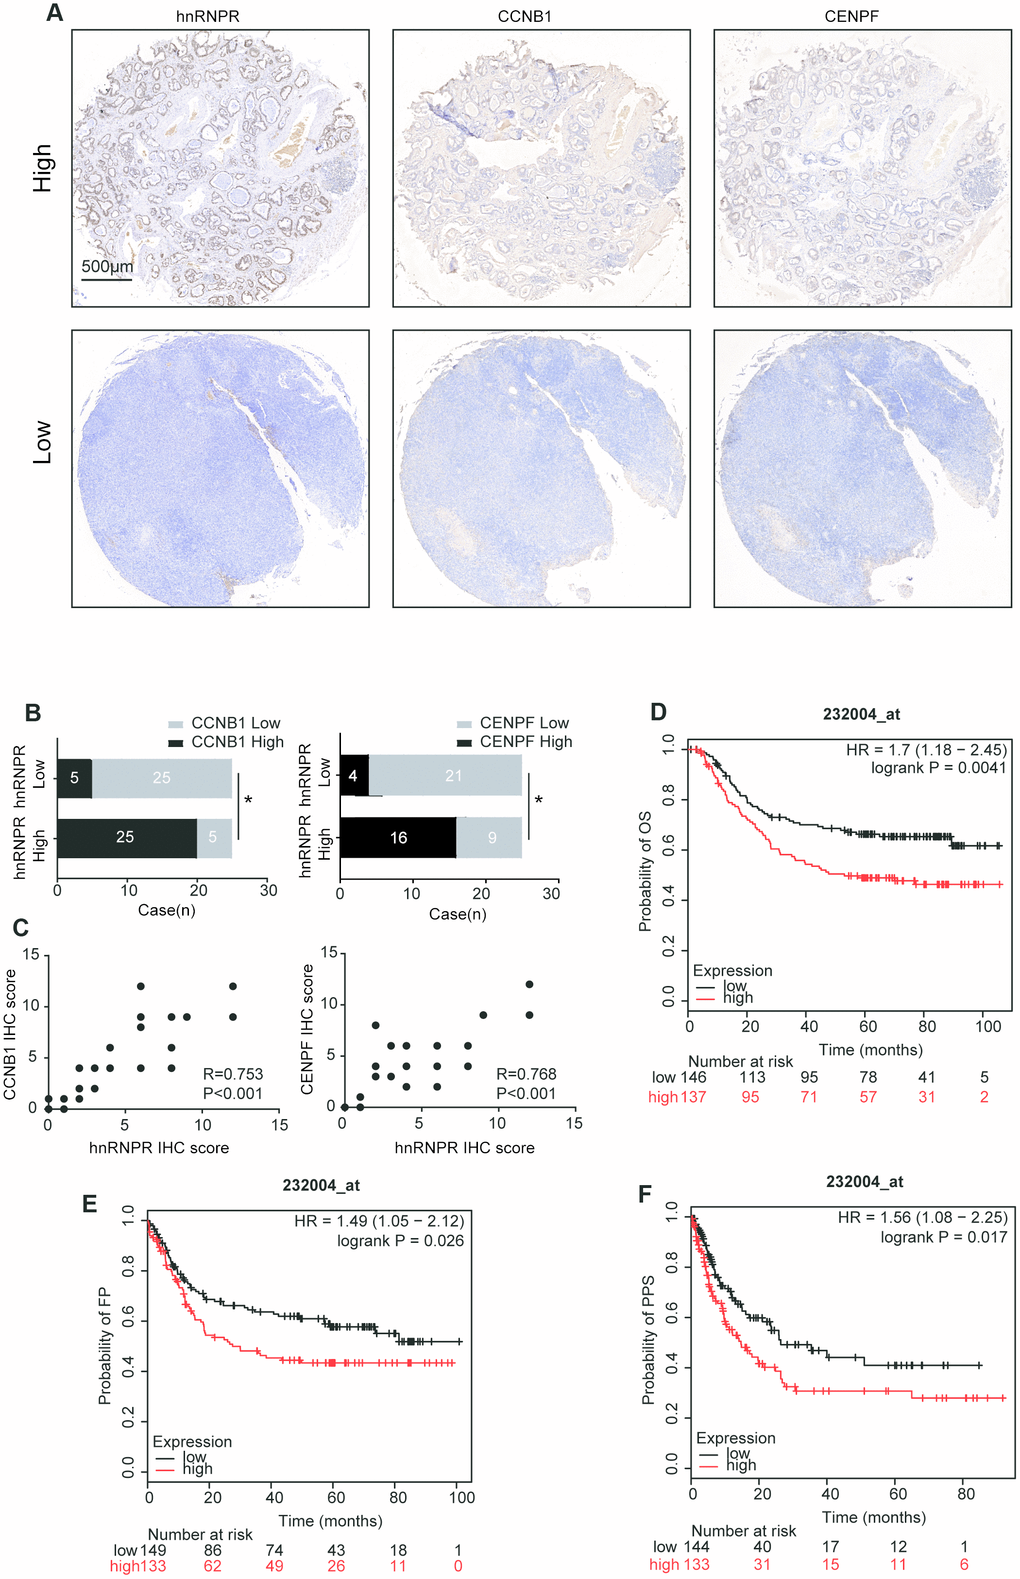
Figure 6.hnRNPR expression in the clinical samples. (A) Two representative images showing low or high expression of hnRNPR, CCNB1, and CENPF in human GC tissues. Scale bars 500μm. (B) Human gastric cancer tissues were used for hnRNPR and CCNB1/CENPF staining by IHC and quantitated. Chi-square test was used to analyze the correlation between HnRNPR and CCNB1/CENPF. P<0.05 was considered as significant. (C) Association between IHC score of hnRNPR and CCNB1/CENPF expression. (D–F) Kaplan Meier curves of OS (overall survival), FP (first progression), and PPS (post-progression survival) in a cohort of gastric cancer patients stratified by hnRNPR expression.