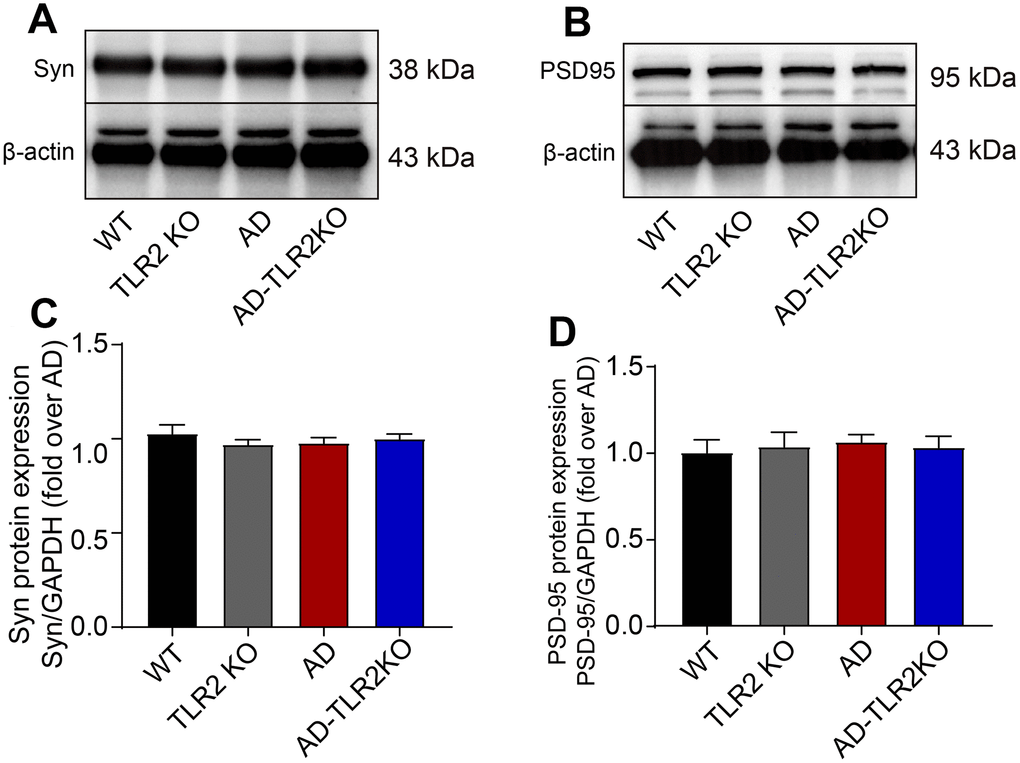
Figure 7.Levels of synaptophysin (Syn) and PSD95 in mouse brains. (A) Representative image of Western blots for Syn. (B) Representative image of Western blots for PSD95. (C, D) There was no significant difference in the levels of Syn (C) and PSD95 (D) between AD and AD-TLR2KO mice. (n= 6 / group).