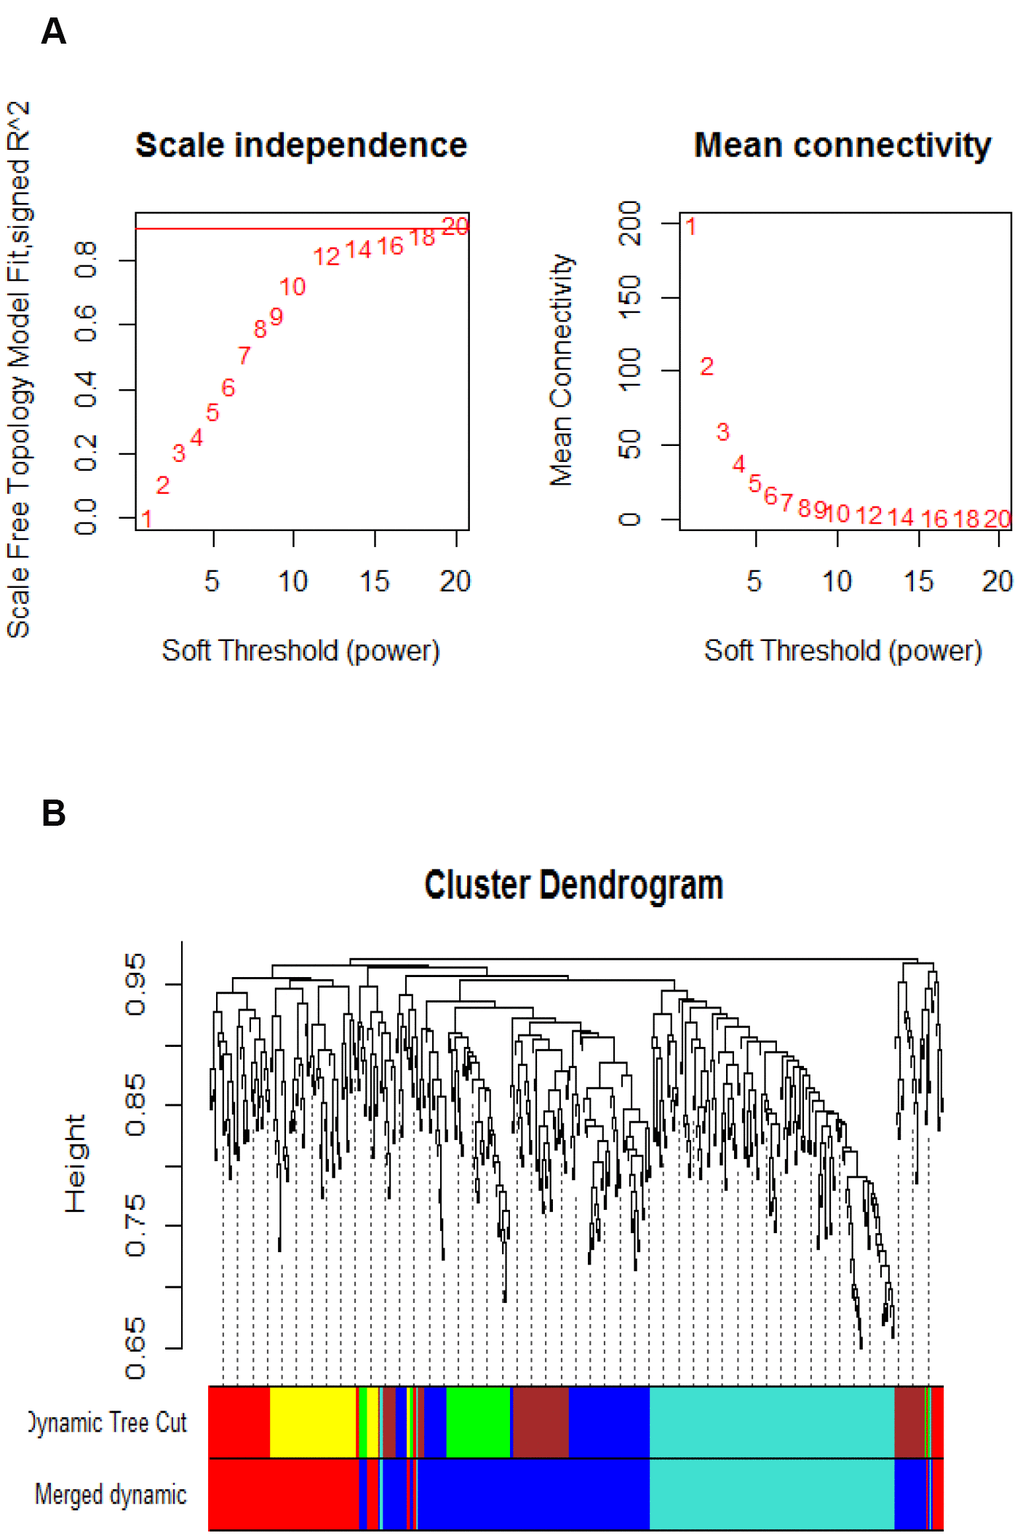
Figure 1.Parameter analysis of inferred co-expression network and modules. (A) A scaling factor beta determination based on the scale-free topology criterion. (B) Hierarchical clustering of genes in significant modules. The colors are assigned to each module by the Dynamic Tree Cut algorithm.