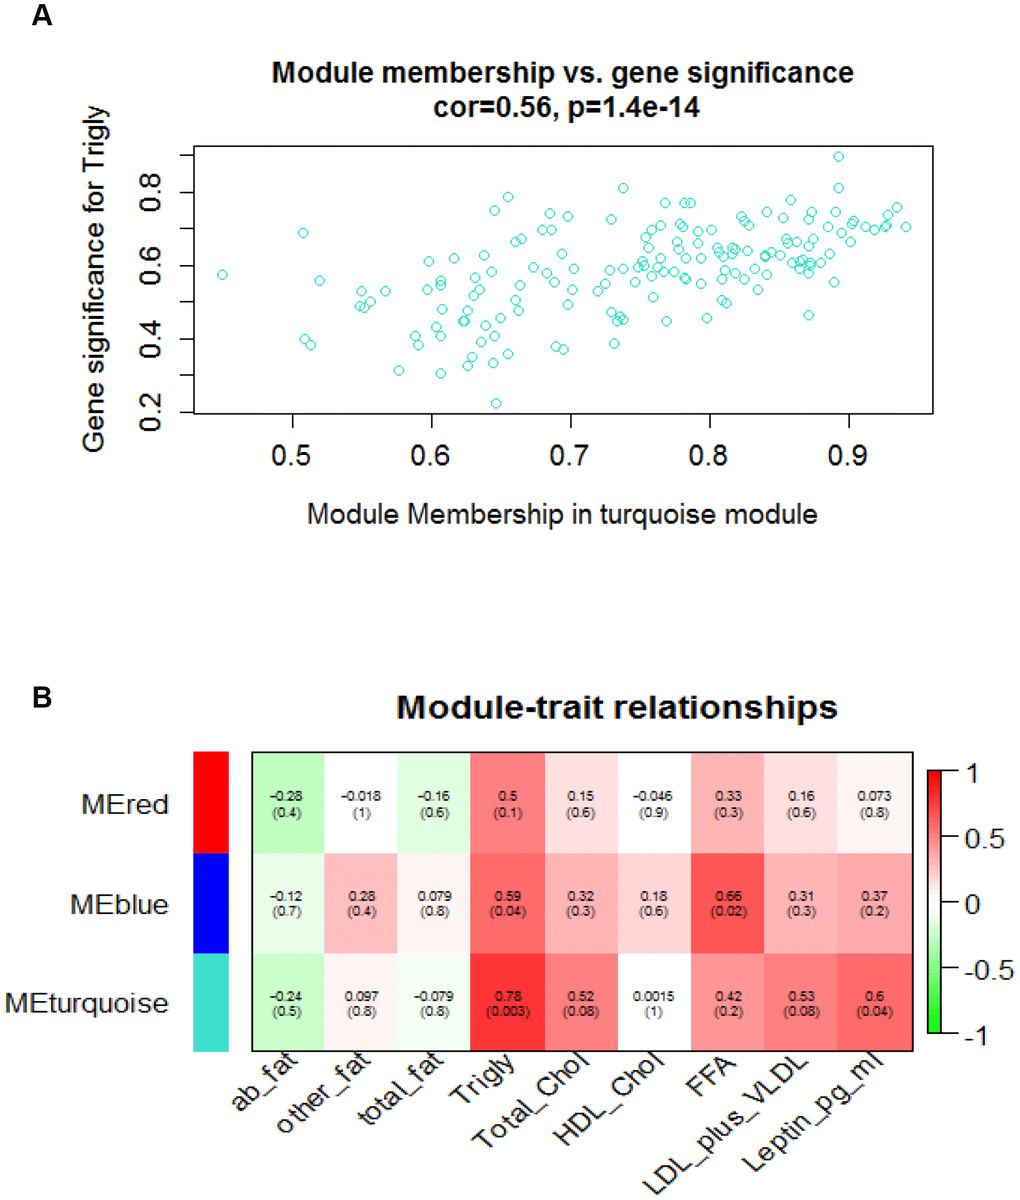
Figure 2.Module-traits and module_membership-gene_significance correlation analyses. (A) Scatterplot shows a highly significant correlation between gene significant (GS) versus module membership (MM) in the turquoise module with Triglyceride. (B) Heatmap shows correlation between assayed traits and module eigengene values. Green and red colors represent the negative and positive correlation respectively. Decimals outside of round brackets are correlation, and decimals inside of round brackets stand for gene significance level.