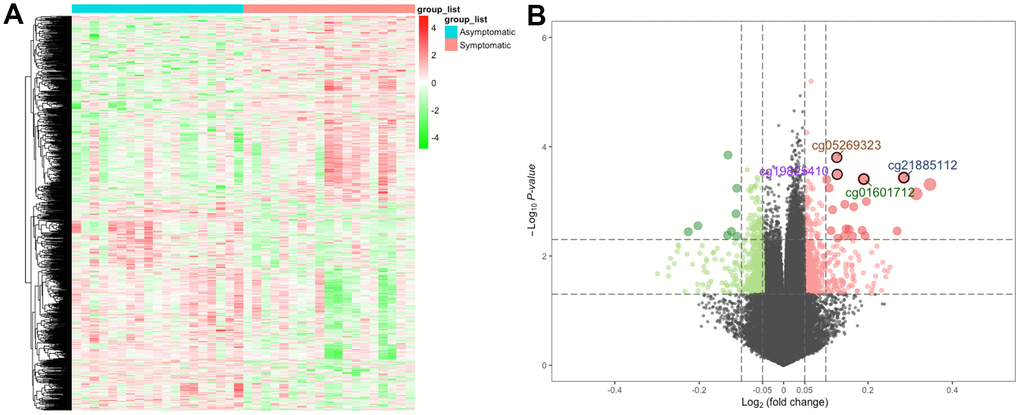
Figure 1.The heatmap and volcano plot for DMPs. (A) For the heatmap, the red strip represents symptomatic samples and the green strip represents asymptomatic samples. (B) For the volcano plot, the two vertical lines are the 0.05-fold change boundaries, and the horizontal line is the statistical significance boundary (P < 0.05). Items with statistical significance as well as hypermethylation are presented as red dots, and hypomethylation is presented as green dots in the volcano plot.